Arizona’s new state test, AzMERIT, shifts high school testing from a tenth grade exam to end-of-course assessments in grades nine through eleven. This shift presents new challenges and opportunities for policy makers to consider when building a state accountability system. These dynamics will likely play out in a variety of ways when calculating percent passing and percentage tested. It will be important for policy makers to understand the potential impacts prior to the development of any accountability system.
What’s the Big Deal?
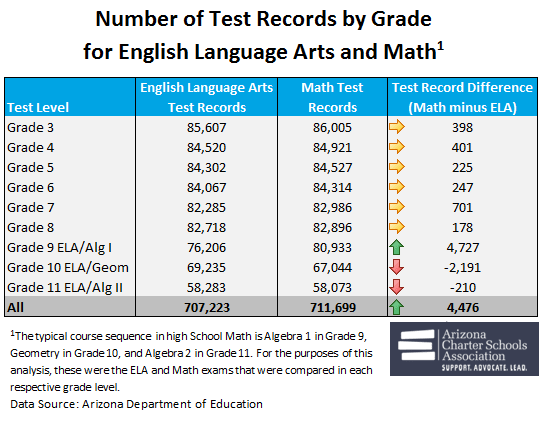
With the passage of SB1430 the State Board of Education will begin to develop its A-F methodology. The cornerstone to any state accountability system is student level test scores that are used to calculate passing rates and growth scores. In preparation for this work, the Association began analyzing the 2015 AzMERIT data and discovered significant differences in the number of test records between English Language Arts (ELA) and Math, especially at the high school level. Given the importance of these data, we set out to investigate the causes and understand the impact. Table 1 shows the number of test records for ELA and Math for each grade level. At nearly every grade level, the number of Math test records is greater than those for ELA.
In order to understand the effect of these results, the Association evaluated them in context to the overall enrollment by grade. Table 2 presents grade-level enrollment and a calculation of the percent tested within each content area, as a point of reference. These data are also reported out by district and charter schools in order to identify any potential differences by type of school.Table 2:
The use of October enrollment, the only publicly available enrollment file, may impact the “percentage tested” calculations; it is unclear how enrollment changes closer to the testing window could affect these results. These data show that for almost all elementary grades (grades 3-8), test records account for 99 to 100 percent of grade level enrollment. Until Grade 8, no compelling difference exists between district and charter schools. However, in Grade 8, math test records account for only 96 percent of grade level enrollment for charter school students, while district schools test 99 percent.
The significant pattern changes that can be seen in the high school “percent tested” columns suggest that the guidance from the Assessment and Accountability divisions within the Department were either unclear or, at best, left room for interpretation. It would appear that district and charter schools implemented the guidance from the Department regarding end-of-course exams very differently; with large differences in percent testing between the types of schools. These data also suggest that districts and charters had differing interpretations of the guidance regarding which students must test for each of the end-of-course assessments.
Several examples of this can be seen throughout high school testing. For example, Grade 9 ELA test records account for 104 percent of Grade 9 enrollment in charter schools and 88 percent of Grade 9 enrollment in district schools. Algebra I test records in math account for 130 percent of Grade 9 enrollment in charter schools and 92 percent of Grade 9 enrollment in district schools. This suggests that district schools have significantly fewer freshmen taking the Grade 9 ELA test than taking the Algebra I test, and that charter schools are likely testing grades other than freshmen in these courses, particularly Algebra I. This could be the result of the significant number of alternative charter high schools that serve over-age, credit deficient student populations. The October enrollment file shows 118 alternative charter schools serving Grade 9 students.
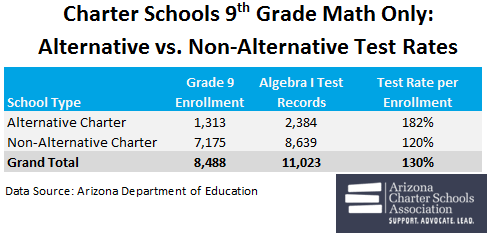
In order to investigate this further, the Association evaluated the percentage of ninth grade students tested within charter schools by comparing alternative charter high schools to all other charter high schools. The results shown in Table 3 suggest alternative charter school students are taking the Algebra I exam beyond Grade 9, and are likely taking multiple end-of-course exams in a given year. This finding is consistent with the student population enrolled in alternative schools and likely explains a significant portion of the overall difference between charter and district schools.
Table 3:
WHY IS THIS IMPORTANT?
These results suggest that guidance from multiple divisions within the Arizona Department of Education resulted in districts and charters making choices about which students should be tested and with which test they should be given. Without clear policies regarding test taking and the use of test scores for school accountability, the technical validity and overall fairness of any accountability system may be jeopardized.
As state policy makers begin to consider the components and methodology that will be used to calculate A-F and federal accountability formulas, it will be important to understand the impact of end-of-course assessments on availability of data and its use. Unlike the previous state assessment, AzMERIT and the use of end-of-course assessments significantly increases the complexity of available testing data. These new data need to be fully understood prior to their use for high stakes decisions.
Policy makers should focus on the following areas for consideration: understanding the requirements for end -of-course exam administration and how they impact testing; determine how multiple scores associated with individual students will be used in accountability decisions i.e., calculation of percentage passing; determine how a greater than 100% tested rate will impact accountability decisions. With each of these areas, clear and timely guidance to the field will be necessary to ensure that schools are not adversely impacted by their testing decisions. Without this, the foundation of our state’s accountability system (the test score) will be under scrutiny and the reliability and validity of the overall rating will be suspect.


