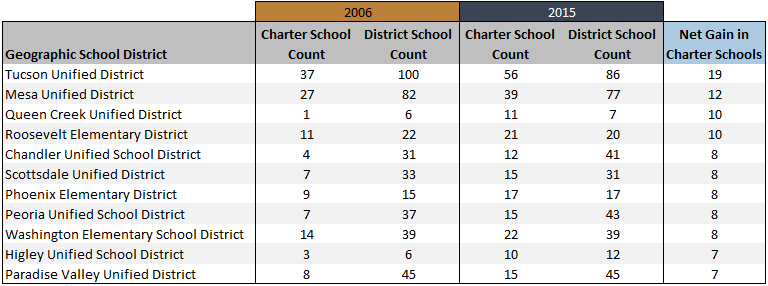
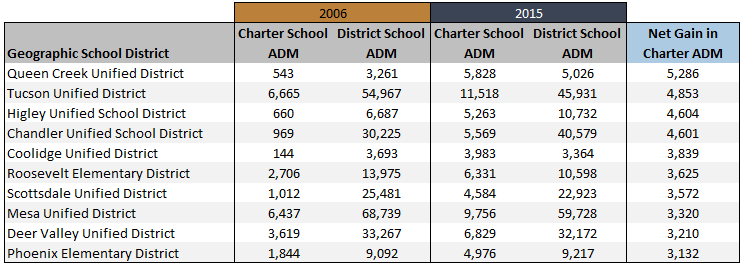
Where has Arizona’s charter school movement grown in the last decade? We found that Tucson Unified School District saw the most new charter schools within its borders, gaining 19, while Queen Creek Unified School District gained the most charter students, increasing by 5,286[1].
In Part 1 of our series, we analyzed the net gain of charter schools and students within school district boundaries from FY06 to FY15. In a previous blog we examined overall state attendance trends at the county level.
CHARTER SCHOOL GROWTH WITHIN DISTRICT BOUNDARIES
Figure 1 shows school districts that have had the greatest net gain of charter schools within their geographic boundaries from 2006 to 2015[2]. “Net gain” in charter schools is just that – the difference in number of charter schools within a district’s boundaries in 2006 and 2015. It is possible that any number of schools could have actually opened or closed in the years between these two snapshots in time, but in this blog we focus on the net change in the number of schools within a district attendance area.
FIGURE 1: GEOGRAPHIC SCHOOL DISTRICTS WITH LARGEST NET GAIN IN CHARTER SCHOOLS, FY06 TO FY15
Most of the net growth of charter schools has been focused in school districts surrounding Phoenix and Tucson, with Tucson Unified leading the state. Large districts in the northern and southwestern parts of the state have also seen modest net gains in charter schools within their boundaries, namely Yuma Elementary District (2), Flagstaff Unified District (2), Camp Verde Unified District (2), Humboldt Unified District (3) and Prescott Unified District (3).
Perhaps more intuitive and interesting than the table in Figure 1, though, is a look at how the net gain numbers have actually played out throughout the landscape of the state. Taking a closer look at the Phoenix area, we can examine which Valley communities have seen the greatest gains in charter schools. Mesa Unified leads the way in the Valley, gaining 12 charters from 2006 to 2015, while Queen Creek and Roosevelt had a net gain of 10 each.
The interactive map below shows charter school net gain by school district. School districts with a net change of 0 have been excluded. Click on the markers to see the district’s net gain in charter schools.
MAP 1: NET GAIN IN CHARTER SCHOOLS BY SCHOOL DISTRICT, FY06 TO FY15
CHARTER STUDENT GROWTH WITHIN DISTRICT BOUNDARIES
In a related but slightly different question, the Association also looked at absolute net change in charter school attendance, rather than number of charter schools. Figure 2 shows the top ten school districts for net charter average daily membership (ADM) gain between 2006 and 2015:
FIGURE 2: GEOGRAPHIC SCHOOL DISTRICTS WITH LARGEST NET GAIN IN CHARTER SCHOOL ADM, FY06 TO FY15
Tucson Unified is still near the top of the list, however, cedes its number one spot to Queen Creek Unified when the question is viewed through the lens of total students rather than schools. Notably, the two districts that appear in Figure 2 that do not appear in Figure 1 are Coolidge Unified District and Deer Valley Unified District. This suggests that these two districts either added a small number of larger charter schools within their boundaries, or saw strong growth rates within the existing charter schools from 2006.
Again, to see how total charter attendance has changed the educational landscape of the state, the Association mapped the net gain or loss of charter students within all school districts. The picture was similar to that of charter school net gain. Click on the markers to see the district’s net gain or less of charter students.
MAP 2: NET GAIN OR LOSS IN CHARTER STUDENTS BY SCHOOL DISTRICT, FY06 TO FY15
Focusing on the Phoenix area’s overall net change in charter student enrollment, we see similar patterns that reflect the number of charter schools gained within each district’s geographic boundaries. Queen Creek Unified, Higley Unified and Chandler Unified are represented by blue dots on the southeast side of the Valley, while districts like Deer Valley Unified and Peoria Unified can be seen on the northwest end.
SCHOOL IMPLICATIONS
Just as the past decade of overall K-12 growth in Arizona paints a misleading picture of certain counties with declining enrollment trends, the growth of charter schools and students over the past decade should be understood at a finer level than simply the evaluation of statewide trends. As our state grows in population, the growth of our public schools should meet the needs of families. Policy makers should consider enrollment trends, geography, demographics, and community needs in making K-12 policy decisions.
In our next blog, the Association will take a closer look at the charter landscape within districts. In it we will evaluate charter student market share within traditional school district attendance boundaries. This analysis will highlight those districts that are saturated based on the number of schools as well as the number of charter students and how these districts have changed over time.
FOOTNOTES/REFERENCES
[1] This blog is part one of a larger series which will focus on Average Daily Membership trends and snapshots as they relate to the geographic boundaries of a school district. This blog will primarily focus on total gains (“absolute” terms), rather than consider the increases in terms of a percentage of existing ADM or existing number of schools (“relative” terms).
[2] Schools that do not serve students in a typical fashion in a geographical location have been excluded. In the case of district schools, the Association used state ADM data gathered at the school and district level. In the case of charter schools, the Association gathered geographical information for all charter schools that are currently open, and assigned them to a geographical school district. For certain types of schools that do not have a geographical location listed with ADE, or whose ADM trends are outside the scope of this blog, data were excluded (such as select online schools, JTEDs, accommodation/transportation schools and select BIA schools). Also, there were 11 total charter schools that existed in FY06 but not in FY15, and these were excluded from the geographical analysis.
Additional Note: The Association also created printer-friendly maps that give an overview of which school districts in the state have seen the most charter school growth within their boundaries. Download our PDF of charter growth in school districts HERE.


