By Ildi Laczko-Kerr
More than 150,000 students are enrolled in charter schools that either received a 2017 A-F letter grade or can’t be rated due to its small size. About 70 percent of these charter students attend an A or B-rated school, compared to 56 percent of district students and 58 percent of the state. This is great news for Arizona’s charter sector, because these data tell us that the overwhelming majority of charter school students are sitting in “quality seats.”
What’s a quality seat?
To determine a ‘quality seat,’ the Association first established levels or tiers of school performance:
• Tier 1 (Quality) includes A- and B-rated schools
• Tier 2 includes C-rated schools
• Tier 3 includes D- and F-rated schools.
We evaluated all public schools- district and charter- in Arizona that received a 2017 letter grade. While we know more work is needed to refine and improve Arizona’s A-F letter grades and measurements of school quality, this statewide measurement allows for equitable quality review among all of Arizona’s public schools – district and charters.
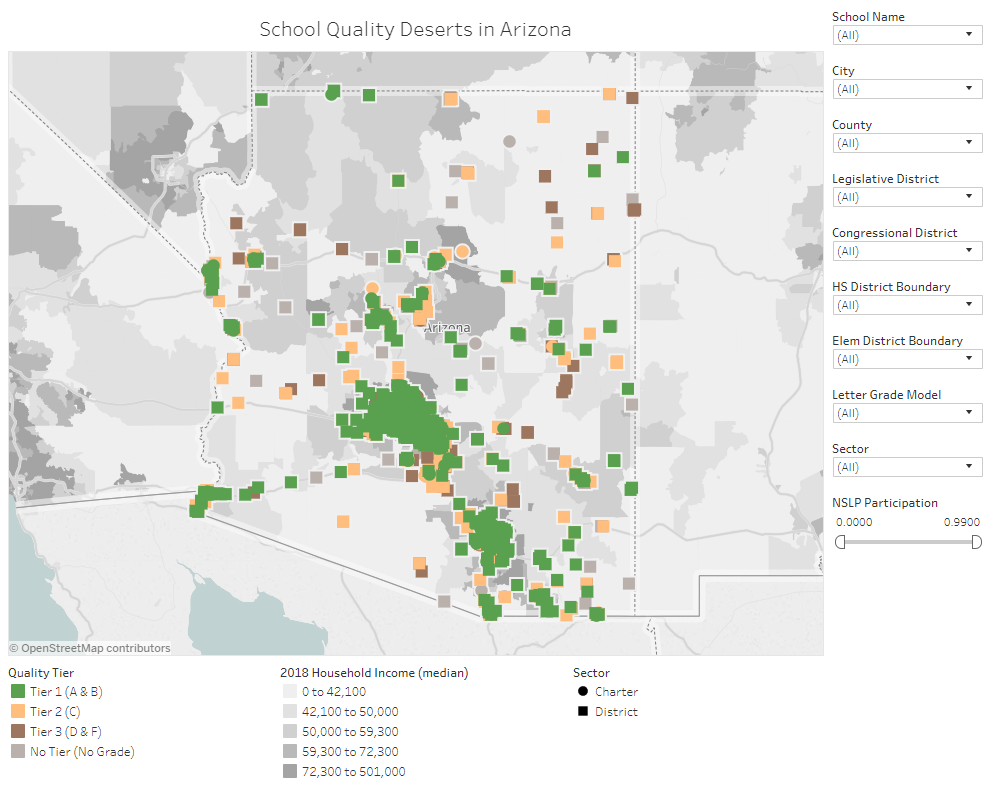
For the purpose of this analysis, Tier 1 represents “quality.” By placing all district and charter public schools into these quality tiers, the Association is now poised to investigate where students lack access to quality schools. In other words, where are the “quality deserts” in Arizona? This type of analysis can be done at multiple levels, including county, city, legislative district boundary and school district boundary, and it has already brought some fascinating results.
For example, looking at access to quality seats at the county level, we can report that the majority of schools in eight of Arizona’s 15 counties can be classified as in Tier 1. An impressive 100 percent of Greenlee County’s schools are in Tier 1; Graham County has no schools in Tier 3. Those counties with the greatest need for more access to quality seats, where the majority of schools are either in Tier 2 and/or Tier 3, include Apache, Coconino, Gila, Graham, La Paz, Navajo, and Pinal counties.
| Percentage of Quality Schools by County | |||
| Tier 1(A & B Rated) | Tier 2 (C Rated) | Tier 3 (D & F Rated) | |
| Apache | 25% | 29% | 46% |
| Cochise | 57% | 31% | 12% |
| Coconino | 36% | 47% | 17% |
| Gila | 47% | 20% | 33% |
| Graham | 41% | 59% | 0% |
| Greenlee | 100% | 0% | 0% |
| La Paz | 11% | 67% | 22% |
| Maricopa | 67% | 26% | 7% |
| Mohave | 53% | 26% | 21% |
| Navajo | 28% | 44% | 28% |
| Pima | 55% | 30% | 15% |
| Pinal | 26% | 44% | 30% |
| Santa Cruz | 53% | 37% | 11% |
| Yavapai | 53% | 35% | 12% |
| Yuma | 50% | 41% | 9% |
| Grand Total | 58% | 30% | 12% |
Using the same data and “tiered” approach, The Center for Student Achievement has created an interactive online tool that displays the geography of quality school options throughout Arizona. Click on the below image to access the tool:
Now that we know where to find the quality seats – and the quality deserts – the Association is better positioned to develop a strategic plan that will support our state’s efforts to increase access to quality charter schools, especially for children in underserved communities. These efforts will include targeted school development, improvement and replication efforts, as well as continued professional development for existing schools.
We already have available a free, online, interactive tool that enables all interested stakeholders to search by zip code or legislative district, not only for 2017 letter grades but also for schools with quality seats. Access the tool at www.educationevaluator.org.

