Arizona’s K-12 Funding Fault Lies In Our Stars and In Ourselves
Arizona has long ranked fairly low in rankings of per pupil funding. Demographic and other factors beyond the reach of a normal budgeting process influence per-pupil funding levels, including age and family size. To illustrate, as a retirement destination with 7.4 million residents, Arizona boasts 1.4 million aged 65 or older, and older people vote at higher rates than people aged for school aged children. Economists have established an empirical relationship between the number of elderly voters and school spending – basically the more, the less.[i] Arizona also ranks eighth in average household size among states.[ii] The impact of larger families requires states to stretch funding over a larger number of students. It is no coincidence for instance that Utah ranks first in average household size and last in per pupil K-12 funding. Rapid rates of enrollment growth also have a depressing effect on per pupil funding. Between 2000 and 2015, all states with at least a 30% increase in per pupil funding experienced less than a 10% increase in enrollment. A majority of states in that category experienced an absolute decline in K-12 enrollment. Those states spent more per pupil in part because they kept spending the same amount of money on fewer students. In Arizona, K-12 enrollment increased by more than 25%.[iii]
Societal wealth and budgetary priorities across policy domains and tax efforts strongly impact K-12 funding. Real per capita income increased by 14.9% between 2015 and 2020, but the state still ranks among the lowest states for per-capita income.[iv] Advocates of increased spending in health care, higher education, public safety and transportation directly contend with K-12 education for increased state investment. Demand always exceeds the supply of public dollars.
The faults that lie in our stars thus include relatively low-income state with large average family sizes, many elderly residents, and relatively rapid K-12 student population growth. Despite all of this, Arizona spends more inflation adjusted dollars per pupil today than it did in the past-a 16.5% increase per pupil between 1999 and 2018 in current expenditures per pupil.[v] Arizona could choose to spend more on K-12 education, either by spending less on other priorities or taxing more heavily. These decisions are made democratically and within a pluralistic competition for resources.
Arizona’s failure to equitably distribute K-12 funding however is a fault that lies within ourselves. As will be outlined below, local funding factors have driven Arizona to distribute K-12 funding inequitably. Worse still policymakers actually equalized K-12 funding in an admirable fashion in decades past, only to subsequently undo the progress. Funding inequality today is even greater than in 1980. Arizona may be vulnerable to legal challenge, and the history of court challenges to school funding systems far from unambiguously positive even when “successful.”
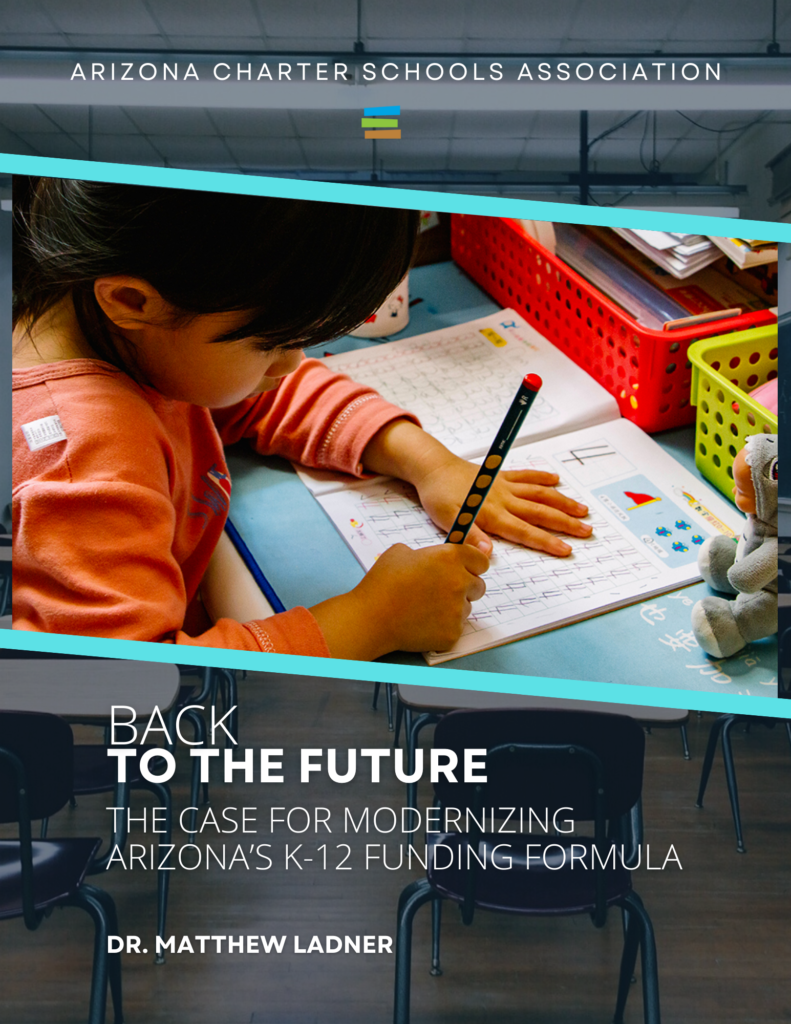
Click below to read the entire paper which presents suggestions for modernizing a funding formula for the needs of the 21st century.
REFERENCES
[i] M. Alejandra and Stefan C. Wolter. 2007. “Are the Elderly a Threat to Educational Expenditures?” Publication of the IFO Institute, CESIFO working paper No. 2089, available on the internet at https://www.cesifo.org/DocDL/cesifo1_wp2089.pdf
[ii] Statistica, 2019. “Average size of households in the United States in 2019, by state.” Publication of Statistica, available on the internet at https://www.statista.com/statistics/242265/average-size-of-us-households-by-state/
[iii] Petrilli, Michael J. 2019. “The Baby Bust Goes to School.” Article appearing in the Summer 2019 edition of Education Next, available on the internet at https://www.educationnext.org/baby-bust-goes-to-school-falling-birthrates-crisis-opportunity/
[iv] DePietro, Andrew. 2021. “United States Per Capita Income by State, 2021.” Article in the December 28, 2021 edition of Forbes, available on the internet at https://www.forbes.com/sites/andrewdepietro/2021/12/28/us-per-capita-income-by-state-in-2021/?sh=68d9eb2e37be.
[v] U.S. Department of Education, National Center for Education Statistics, Statistics of State School Systems, 1969-70; Revenues and Expenditures for Public Elementary and Secondary Education, 1979-80; and Common Core of Data (CCD), “National Public Education Financial Survey,” 1989-90 through 2018-19. Available on the internet at https://nces.ed.gov/programs/digest/d21/tables/dt21_236.65.asp


