How to use the dashboard
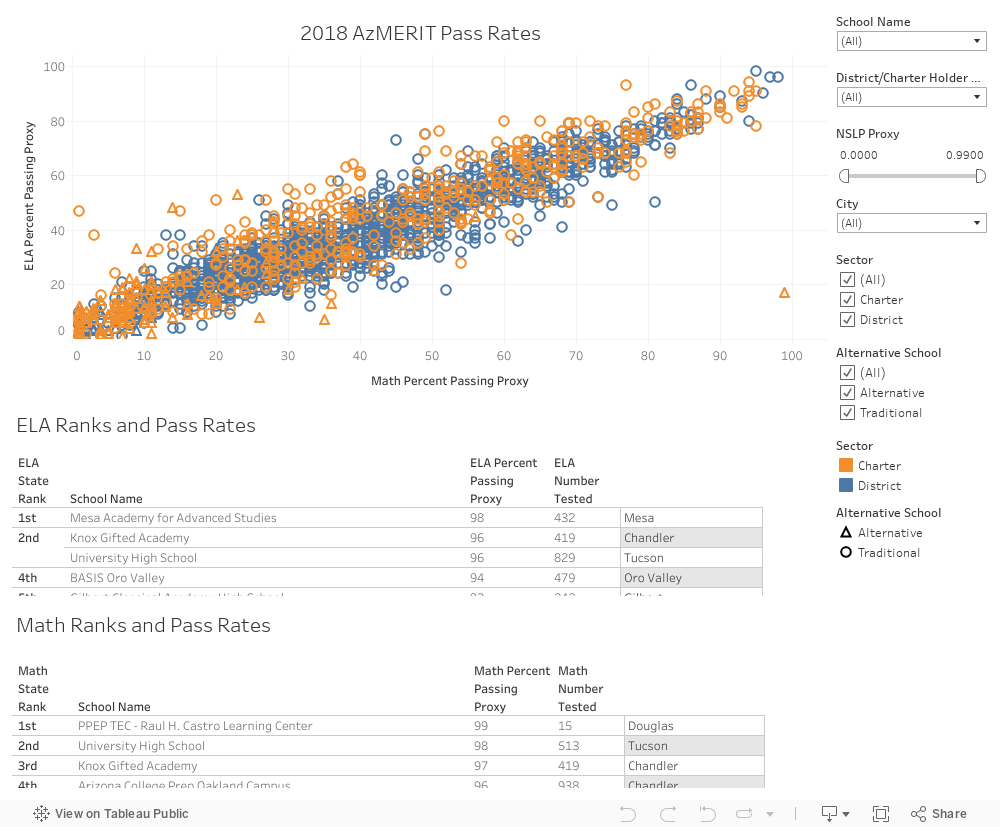
Each icon on the scatterplot represents a school. Hover over an icon to see more information about the school, such as its district/charter holder, its overall pass rate on the ELA or Math exam, or its state rank based on those pass rates.
Use the sliding filter for FRL to examine schools by their reported Free and Reduced Lunch rates. Use the clickable “Sector” and “Alternative” filters to toggle charter schools/district schools, or alternative/traditional schools. The scatterplot icons as well as the lists at the bottom of the dashboard will update to include only the schools that are within the parameters of the filters.
Use the “City” filter to see only the schools that are within a certain city. The scatterplot icons as well as the lists at the bottom of the dashboard will update to include only the schools that are within the given city.
The dashboard will work best on a desktop, laptop, or tablet. You can use the “full screen” icon in the bottom right of the dashboard to maximize the size.
Methodology
- This dashboard displays the pass rates for all students and all test levels within a given school. The data that was used to create this dashboard can be downloaded at the Arizona Department of Education’s Accountability and Research page.
- Each school’s “City” is based on its physical address, not a mailing address or district affiliation.
- Ties in pass rate resulted in the same ranking being assigned to each tied school, and subsequent schools being ranked based on how many schools were tied in the group ahead of them. Example: If the top five schools in the state were tied for first with a 90% pass rate, those five schools would all be assigned a ranking of “1st”, while the school or schools with the next-best pass rate in the state would be assigned a ranking of “6th”.
- The pass rates of schools with fewer than 11 students tested were redacted from the state file. Such schools were not included in the rankings, and are not shown in the scatterplot, as they do not have reported pass rates for ELA or Math.
- Some schools have pass rates listed as as “>=98%” or “<2%” in the state-released file. Such schools were coded with pass rates of “99%” and “1%”, respectively, and included in the rankings. This small adjustment in the reported pass rates is the reason why the x- and y-axes are listed as “Math Pass Rate Proxy” and “ELA Pass Rate Proxy”.
- Free and Reduced Lunch rates are sometimes reported to ADE as ranges, such as “40-49%”. Such reported FRL rates were recoded with an “FRL Proxy” that is a number, such as 45%. Additionally, several schools in the state do not report FRL rates. These schools were assigned an FRL Proxy of 0%.
- For the 2017 version of this tool, click here.