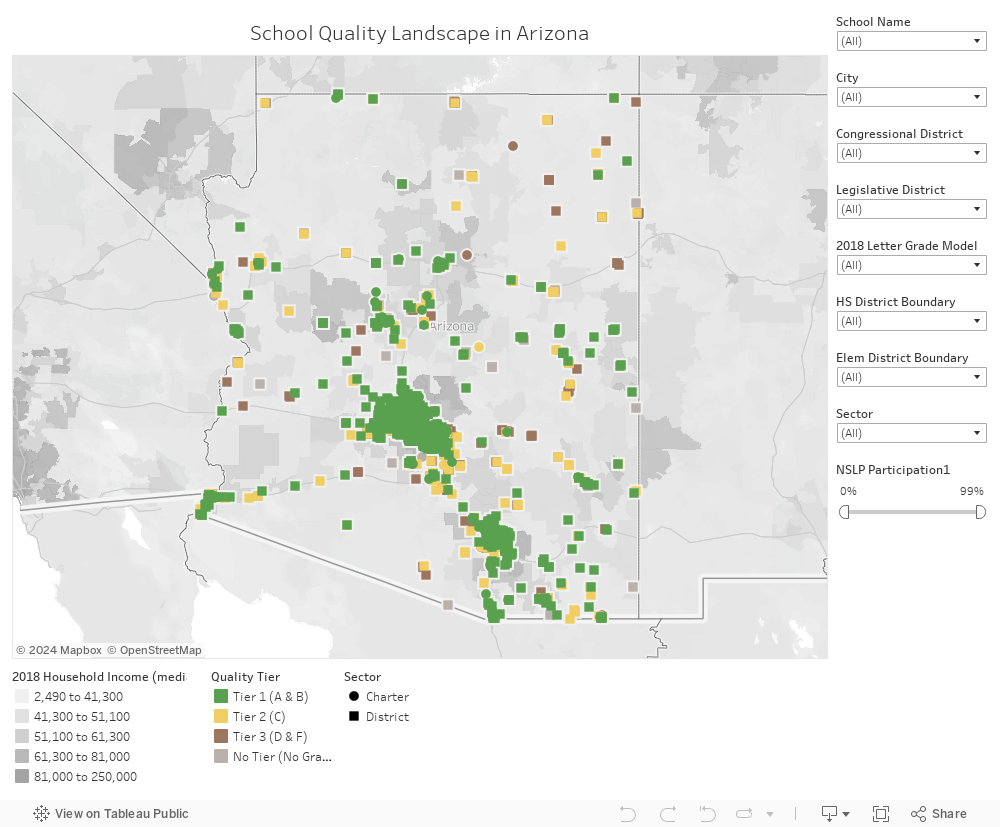
The interactive map below can be used to asses the landscape of quality schools throughout Arizona. Every school that received a letter grade in 2018 has been categorized into a tier – Tier 1 (A & B), Tier 2 (C), and Tier 3 (D & F). Use the filters on the right to examine the data by city, county, and other attributes. It is best to access the tool from a laptop or tablet, rather than a smartphone.
Methodology
Schools that existed for any part of the 2018-19 school year are included in the map, but letter grades are from the 2017-18 school year. The 2017-18 school year letter grades are the most recent given by the Department of Education.
This tool has been updated to reflect the results of all letter grade appeals.
Several schools did not receive a letter grade for a variety of reasons, most commonly: non-tested grades, small school size, alternative school status, online school status, new in 2018-19.
Not every school participates in the National School Lunch Program (NSLP). Schools that did not have a reported percentage were assigned a participation rate of 0%.
The filter options of “HS Dist Boundary” and “Elem Dist Boundary” filter the data by the geographic boundaries of a given high school or elementary school district. Since the boundaries of this filter are purely geographical, charter schools that sit within a given school district will remain on the map.