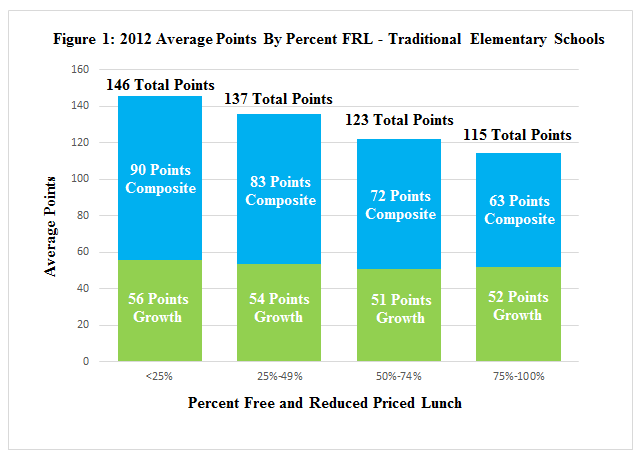
In 2012, the Association released School Ratings: Improving The Data In Data-Driven Decision Making where we examined the relationship between Arizona’s A-F school letter grades and the level of poverty in a school. We found that a school’s letter grade is highly and negatively correlated with the percentage of its students who qualify for free and reduced priced lunch. In other words, schools with high percentages of poor students received lower letter grades, on average, than schools with more affluent students. This relationship is due, in great part, to the way in which Student Growth Percentiles (SGPs) are used in the accountability formula. Specifically, we found that the number of “growth points” awarded in the formula is artificially capped by the calculation which uses the averages of multiple medians.
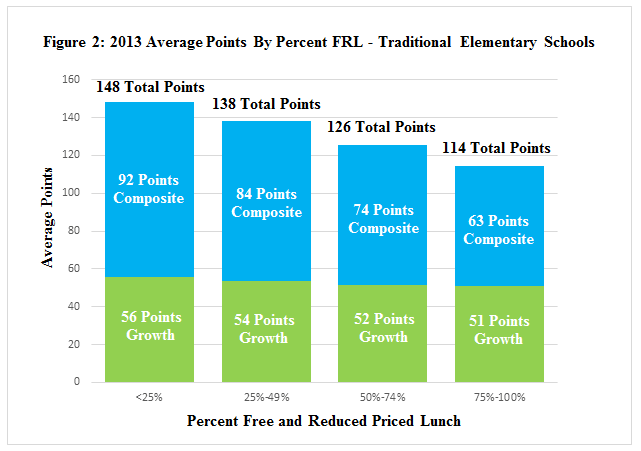
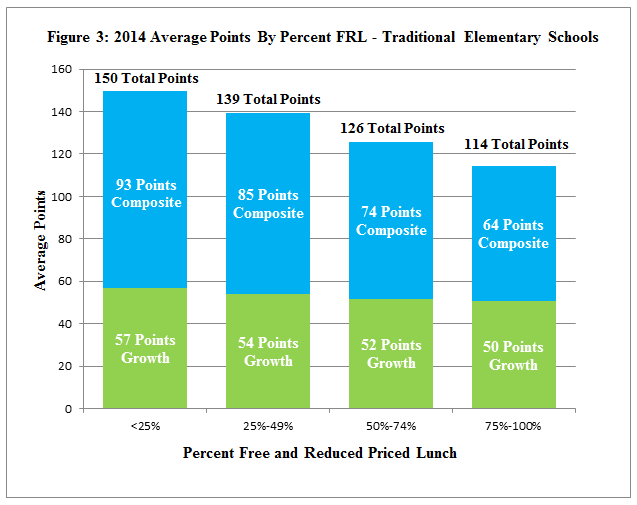
After broadly communicating these concerns to state-level policy makers, which resulted in no changes to this portion of the A-F formula, we wondered if this was still the case in 2013 and 2014. As we expected, schools continued to earn most of their letter grade from the percentage of students who are proficient on AIMS (composite points). As the percentage of poor students in a school increases, the percentage passing continued to decrease (see Tables 1, 2 and 3). A closer look at the SGP scores show, as they did in 2012, that growth points remain consistent across poverty levels, meaning that growth is not strongly related to student demographics.
As in the initial 2012 report, we again call into question the implementation of the current accountability model. State statute (ARS§ 15-241) clearly calls for equal weight to be assigned to student achievement and growth (50-50), what we continue to see is closer to 60-40, weighted toward AIMS passing scores, a measure highly related to poverty.
Evidence from three years of A-F results indicates that under this accountability model, schools with high levels of poverty are at a disadvantage. For example, the difference in composite points between a school where less than 25 percent of its students qualify for free and reduced priced lunch and a school where more than 75 percent qualify is 29 points, or the difference between an A and C letter grade. Given these consistent findings, we must ask ourselves “Is our school accountability model measuring school quality or student demographics?”
In the coming year, the Arizona Department of Education and the State Board of Education have the opportunity to develop a new school accountability model to reflect the change in the state’s new College and Career Ready Standards. We encourage our state policymakers to consider this research and develop accountability models that more accurately measure school quality, rather than student demographics, so that schools with the toughest challenges aren’t disadvantaged.