Educating children often requires much more than quality instruction; most educators agree on the need to offer services that meet students’ social, emotional, and material needs if students are to succeed in the classroom[1]. Depending on the school, grade level, and student demographics, these additional needs can take the form of school counselors, social workers, before and after school programs, or parent outreach. Such services have been a part of the recent discussion around classroom vs. non-classroom spending.
Missing from the conversations about spending is an acknowledgement of the percentage of students in Arizona public schools who are living in poverty and as a result are more likely to need and benefit from “non-classroom” services. In the coming year, schools will likely face further reductions in budgets and increased pressure to “put more money in the classroom.” In order to provide some context and insight into the challenges facing Arizona public schools, the Association feels that it is beneficial to examine statewide trends in student poverty[2].
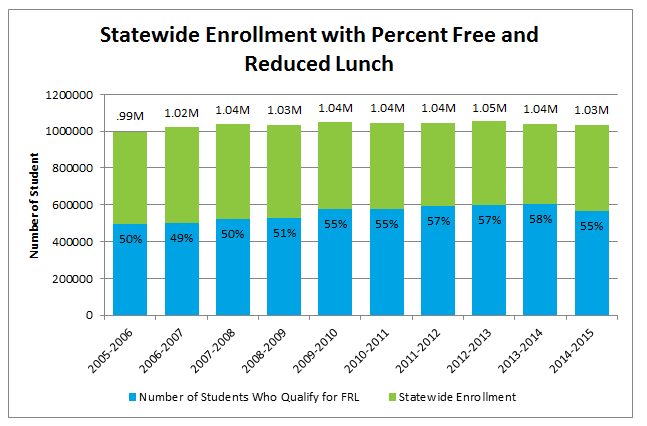
The graph presents statewide student enrollment in Arizona’s public schools and the number of students who qualified for free and reduced price lunch during the past 10 years[3]. As the graph shows, overall enrollment in Arizona public schools has fluctuated at just over one million students during this time. In comparison, the data indicate a steady increase in the percent of students eligible for free and reduced price lunch from 2007-2008 through 2013-14. In the most recent year, there is a slight decrease (-3%) reported.
The slight decrease in poverty in 2014-2015 may be an indicator of economic recovery and if it continues one would expect a decrease in the demand for student supports in schools as fewer families live in poverty. All other school spending being equal, one would expect a corresponding increase in the percent of funding that goes to the classroom.
Footnotes
[2] Data for this analysis were taken from the “Average Daily Membership” (ADM) and “Percentage of Children Approved for Free or Reduced-Price Lunches” files made publicly available by the Arizona Department of Education.
[3] We acknowledge that eligibility for free and reduced price lunch is a proxy indicator of poverty and that there are limitations to its usefulness. Schools that do not participate in the National School Lunch Program do not have FRL data and there are a number of reasons why schools may not participate in the program. However, this does not mean that these schools do not enroll poor children. As a result, the numbers reported by the state should be considered conservative estimates.