One in forty boys in Arizona is diagnosed with an Autism Spectrum Disorder[1]. This statistic and others indicate a growing population of students with special needs in our schools. Given this, it’s not surprising that policy makers, teachers, and advocates have been calling for additional supports for students with special needs. The Governor’s Classrooms First Council has taken up this call during its discussions of Arizona’s school finance formula.
The Classrooms First Council released their preliminary recommendations[2] in September. The recommendations represented significant consensus among the Council in three key areas: equitable funding, student-centered learning priorities, and recognition of excellence. Two key student-centered learning priorities recommendations received wide spread support: (1) fund special education students according to the 2007 cost study and (2) fund the existing “Extraordinary Special Needs Fund” to address high-cost students for all public schools. These recommendations were made while recognizing additional new dollars would be needed for implementation. The 2007 cost study demonstrated that $144.8 million[3] in additional funding would be needed just to fund expenses; adjusted estimates based on an inflator formula put these dollars closer to $400 million today. These estimates do not address the funding of the Extraordinary Special Needs Fund.
Given the strong support for these two recommendations, the Association set out to analyze special education funding data to determine the magnitude and potential impacts of these recommendations. The findings of our analyses will be released throughout the next months. The first in this series presents longitudinal trends in special education enrollment as well as current student enrollment data by disability type and severity and addresses the first policy recommendation of the Council.
The Findings
The first policy recommendation — fund the 2007 special education cost study — appears to be straightforward. Our analysis of current special education data indicate that the impact of this recommendation is likely significantly greater than initial estimates. Initial estimates indicated that the gap (in 2007) was $144.8 million in additional funding. However, that estimate was based on 2006-07 enrollment data, which indicated a statewide total special education student enrollment of 117,095.78[4]. National Center for Education Statistics data reported for the same time period indicates that statewide special education student enrollment for the same time frame was 124,019; this 6% difference is a significant underestimation of students in the initial cost study. Analyzing the longitudinal trends from 2006-07 to 2013-14 indicates that Arizona’s special education population has increased by 5% (see table).
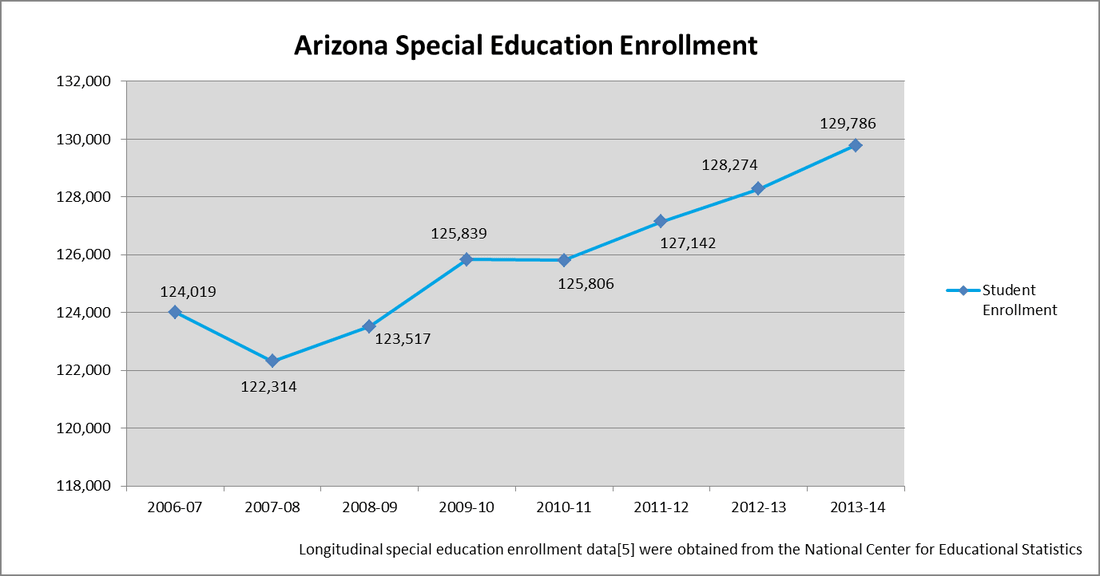
Given the increased special education population demonstrated in the longitudinal analysis, it’s reasonable to believe that the initial cost estimates will need significant adjustments to account for the current special education enrollment. These adjustments are necessary to appropriately fund services designated in students’ Individualized Education Plans (IEPs), as these expenditures are legally required and services are federally protected. This is true regardless of how much K-12 funding the state provides.
As a result, school districts and charters are forced to make untenable decisions regarding the allocation of tight resources. Since special education services must be delivered, no matter the amount of statewide education funding, school districts and charters must pull resources from the 88 percent of students who are not designated to receive special education services. Alternatively, the under-funding of special education creates dis-incentives to properly identify, serve and support these students. Neither of these options supports our students.
This is the first blog in our Special Education Funding series. Part II can be found here, and Part III can be found here.
Footnotes/References
[1] http://www.cdc.gov/ncbddd/autism/states/addm-arizona-fact-sheet.pdf
[2] Classrooms First Council Recommendations http://education.azgovernor.gov/sites/default/files/cficpreliminaryframework9-22-15revisedv4.pdf
[3] Classrooms First Council presentation on special education funding http://education.azgovernor.gov/sites/default/files/8-27_sclp_presentations_all.pdf
[4]2007 Special Education Cost Study www.azed.gov/special-education/files/2011/06/specialeducationcoststudy2007.pdf, the cost study utilized Average Daily Membership (ADM) which results in portions of student funding, hence the 117,095.78 figure used.
[5] NCES data U.S. Department of Education, National Center for Education Statistics, Common Core of Data (CCD), “Local Education Agency (School District) Universe Survey”, 2006-07 v.1c, 2007-08 v.1b, 2008-09 v.1a, 2009-10 v.2a, 2010-11 v.2a, 2011-12 v.1a, 2012-13 v.1a, 2013-14 v.1a; “State Nonfiscal Public Elementary/Secondary Education Survey”, 2013-14 v.1a.