In this third installment of our series of special education funding blogs, we sought to better understand the enrollment patterns of special education students across Arizona. We learned the enrollment of special education students varies widely across counties and within and between districts and charter schools in Arizona, especially when severity of special education disabilities is taken into account. It is important to note, though, that the Group A portion of the school funding formula (see Blog Part II) assumes a relatively even distribution of special education students across the state. Our research suggests parents of students with special needs seek out communities (counties or school districts and charters) where services best match their student’s needs.
To understand the enrollment patterns of our special education students, we calculated two indicators that provide insight into the distribution of students with special needs across different public schools, and the severity of their disabilities. The two measures we analyzed are:
Percent Special Education—this is the proportion of students enrolled in the district or charter who are identified as requiring special education services. This measure allows us to compare the concentration of special education students across districts and charters.
- [special education students] ÷ [total enrollment]
Percent Weighted Special Education—this is the proportion of special education students enrolled in the district or charter, multiplied by the each student’s funding weight. The greater the weight, the more severe the disability. For example, one (1.0) special education student with a weight of 7.947 (multiple disabilities with severe sensory impairment) is equal to a weighted student count of 7.947. This measure allows us to compare the severity of special education population across schools.
- Σ[special education students x funding weight] ÷ [total enrollment]
Table 1 below shows the percent of special education students and the percent of weighted special education students for each county in Arizona.
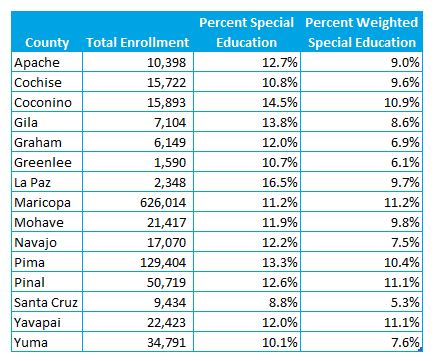
La Paz County’s percent special education is the highest of all counties (16.5%), indicating it has the largest proportion of student identified as needing special services. However, once the severity of the disability categories are taken into account, the percent weighted special education is 9.7%, which places it in the middle of the pack.
The counties with the lowest percent of weighted special education students are also some of the least populated counties in the state: Santa Cruz, Greenlee, Graham, etc. This suggests that families whose special education needs are more intensive seek schools in more populated counties, with larger school districts better positioned to provide services. Maricopa County, the largest county in the state, is also the county with the highest percent of weighted special education students (11.2%).
Table 2 shows the same information for the fifteen largest school districts in the state.
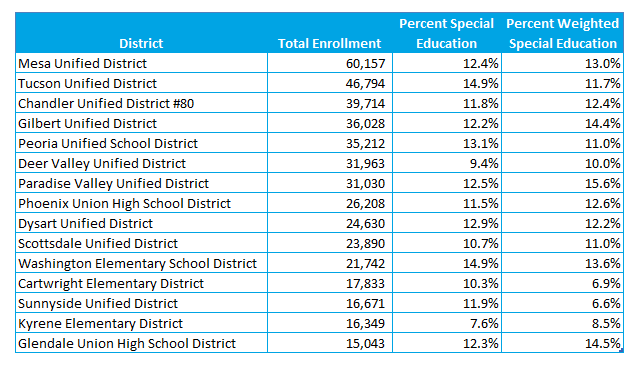
The percent of special education students ranges from 7.6% to 14.9%, showing differences in the concentration of special education students across the largest school districts. When the severity of disabilities is taken into account, the range grows from 6.6% to 15.6%. Tucson Unified and Washington Elementary provide a good example of the shift: they both have 14.9% special education students (the highest of all the big districts), but their percent weighted special education are 11.7% and 13.6% respectively, suggesting that, in general, the needs of the special education population in Washington Elementary are more severe than those of students in Tucson Unified.
Table 3 shows the information for the state’s largest charter organizations.
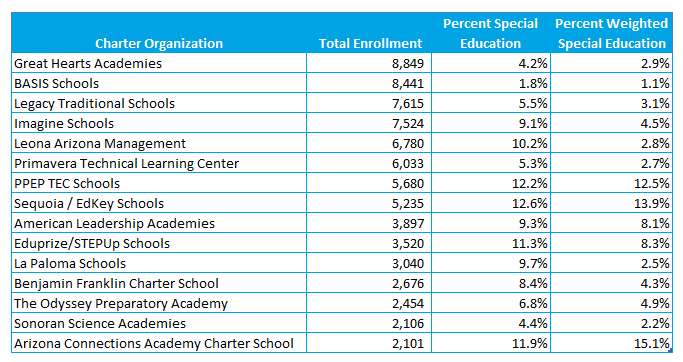
The percent of special education students ranges from 1.8% to 12.6%. When the severity of disability categories is taken into account, the range widens further: from 1.1% to 15.1%. Overall, the rates of both special education and weighted special education are lower than those of school districts, but the wider range reflects the more specialized approach of some charter schools, including those that set out to serve primarily special education students.
Table 4 shows the information for the fifteen districts and charters with the highest percentages of weighted special education students.
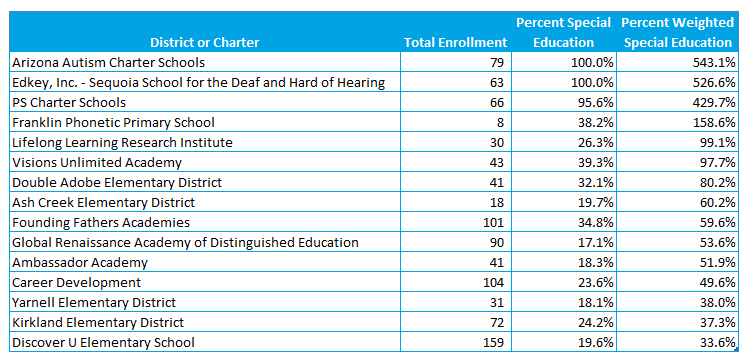
In this case, the percent of special education students ranges from 17.1% to 100%, but once the severity of the disabilities are taken into consideration, the percent of weighted special education students ranges from 33.6% to 543.1%. Arizona Autism Charter School and Sequoia School for the Deaf and Hard of Hearing, part of the EdKey schools in Table 3, enroll only special education students and the corresponding weights of those disabilities result in percent weighted special education numbers well over 500%.
These data, coupled with the nature of charters, suggests that the charter schools on this list have specifically sought to serve special education students. It is unclear, using only these data, whether the same holds for the districts on the list. Double Adobe, Ash Creek, Yarnell, and Kirkland districts are all small, have a relatively high percent of special education students and when the severity of the disabilities is taken into account, the percent of weighted special education students is even higher.
While our analyses show the enrollment of special education students varies widely, the data suggests that parents of students with special needs seek out communities (counties or school districts and charters) where services best match their student’s needs. Without a relatively even distribution of special education students across Arizona, special education funding must be reviewed and updated, particularly for those districts and charters that are serving a greater proportion of special education and weighted special education students.
This is the third blog in our Special Education Funding series. Click here to read part 1, and click here to read part 2.