Arizona charter student enrollment has increased from nine percent of all Arizona students in 2006 to 15 percent of students in 2015, an increase of nearly 74,000 students. Given the significant growth in the charter sector, most counties saw an increase in the total number of students enrolled in charter schools. However, not all counties grew their charter populations at the same rate.
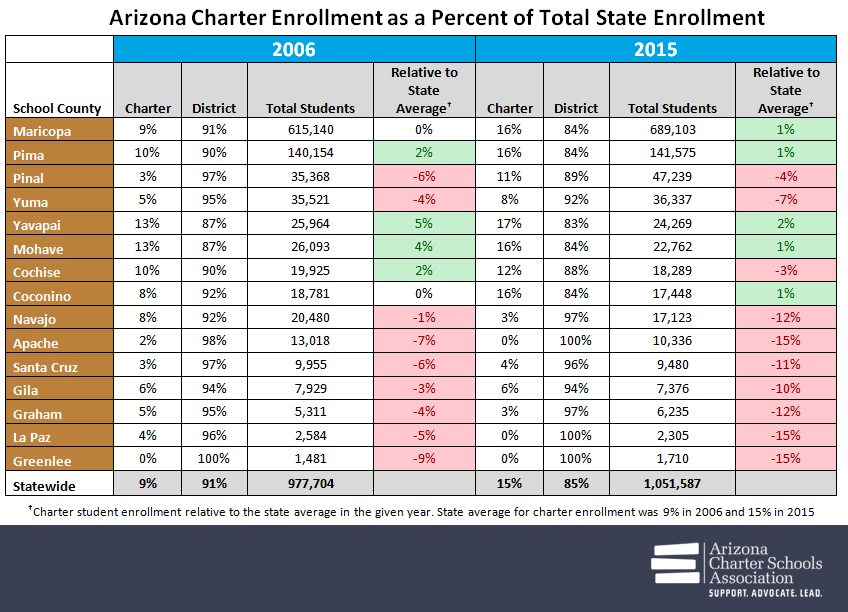
The table below summarizes district[1] and charter school enrollment in each county, sorted by county enrollment size, from largest to smallest.
Since enrollment trends in charter schools parallel county enrollment trends to some extent (see our March blog), one might expect that county size would impact charter enrollment, i.e., counties with fewer students enrolled would have fewer charter schools and vice versa. However, this doesn’t appear to be the case across Arizona.
Take for example Cochise and Coconino Counties, two mid-sized counties with total student enrollment just under 20,000. Despite similar total enrollment in both years, Coconino County saw significant growth in charter enrollment by doubling its charter student enrollment to 16 percent. At the same time, Cochise County saw charter enrollment increase slightly to 12 percent. Yuma County, however, the state’s fourth largest county, enrolls only eight percent of its students in charter schools, slightly half of the state average.
Most counties saw an increase in the total number of students enrolled in charter schools. However, not all counties grew their charter populations at the same rate. In order to gauge the rate of charter growth in each county, we calculated the difference in charter enrollment from the state average for each county in both years.
When considering relative charter enrollment, even counties like Cochise and Coconino that saw enrollment increases in the total number of students saw their relative proportion of the state’s charter enrollment impacted. Coconino County mirrors statewide charter enrollment, while Cochise County’s charter growth has been slower[2].
County Statistics:
- Largest Percentage of Charter Students: Maricopa County – In 2015, charter students made up 16 percent of the student population of Maricopa County, slightly above the state average, similar to results in 2006. This suggests that charter growth in Maricopa County reflects statewide charter growth (given its size, this is not surprising).
- Fastest Growth of Charter Students: Pinal County – Consistent with our March 2016 blog showing Pinal as the fastest growing county, it also has the fastest rate of growth in charters. In 2015, 11 percent of students are enrolled in charter schools, only four percentage points below the state average, compared to 2006, when only three percent of its students were enrolled in charter schools.
- Fastest Decline of Charters: Navajo, Apache and La Paz Counties –
- Navajo County enrolled eight percent of its students in charter school in 2006, just under the state average. By 2015, however, only three percent of students are enrolled in charter schools.
- Apache County, charter enrollment declined from two percent in 2006 to nearly zero percent in 2015[3].
- La Paz County now has no students enrolled in charter schools, compared to four percent of its enrollment in 2006.
- No Charter Students: Greenlee County – Greenlee did not enroll any charter students in 2006 or 2015.
Our state school choice policies are built on the assumption that school choice and access to charter schools is desirable for all students no matter where they live in the state. These data show that such access and opportunity is not equally available to all students. This snapshot of two points in time suggests dynamics are at work within each county that either encourage or discourage enrollment in charter schools. Further work is needed to identify what those dynamics might be and whether or not these can be (or should be) addressed to provide access to choice across Arizona.
Footnotes:
[1] Joint Technological Education District enrollments are not included.
[2] Coconino’s 16 percent charter enrollment, which doubled from 8 percent in 2006, is just slightly above the state average. Cochise’s 12 percent charter enrollment, which is up from 10 percent in 2006, is still three percentage points lower than the state average charter population.
[3] The only charter school in Apache County in 2014-2015 closed for the 2015-2016 school year.