The Association reviewed the poverty rates of Arizona students over the past six years, and we found that a greater percentage of students are enrolled in schools with higher concentrations of poverty.
In addition to a statewide analysis, the Association analyzed the results by school type (charter/district). The most striking difference between the two groups is the disparity in the percent of students who are enrolled in a school with no free or reduced lunch (FRL) data.
Introduction
There is near universal agreement that students from low income families are more likely to struggle to meet and exceed academic expectations in school. Challenges such as the lack of resources at home, home or food insecurity, lack of books and other learning tools, and stressed or unavailable parents, can all contribute to educational difficulties of impoverished students. The National School Lunch and Breakfast Program exists to mitigate the effect of hunger on learning[i]. For the 2015-2016 school year, a student whose family income falls below 130% of the federal poverty line qualifies for free meals. For a family a four, the threshold is $31,525[ii]. A family of four below 185%, or $44,863, qualifies for reduced-priced meals.
The Analysis
Although not a perfect measure of poverty, the percent of students in a school who qualify for the FRL program is the only proxy currently available to measure the level of poverty and corresponding instructional needs in a school. The Association used FRL data available through the Arizona Department of Education[iii] to analyze the distribution of students living in poverty among Arizona schools and changes in the distribution from 2010 to 2016.
The figure below shows the distribution of Arizona’s students eligible for free or reduced-priced lunch in 2010 and 2016. Each bar represents the percent of total student enrollment in the given FRL range. For example, in 2010, 3.8% of all Arizona students were enrolled in a school with 0 to 9% FRL; in 2016 that percent was about the same (3.7%). The concentration of poverty in a school is demonstrated by the percentage of students eligible for FRL enrolled in the school.
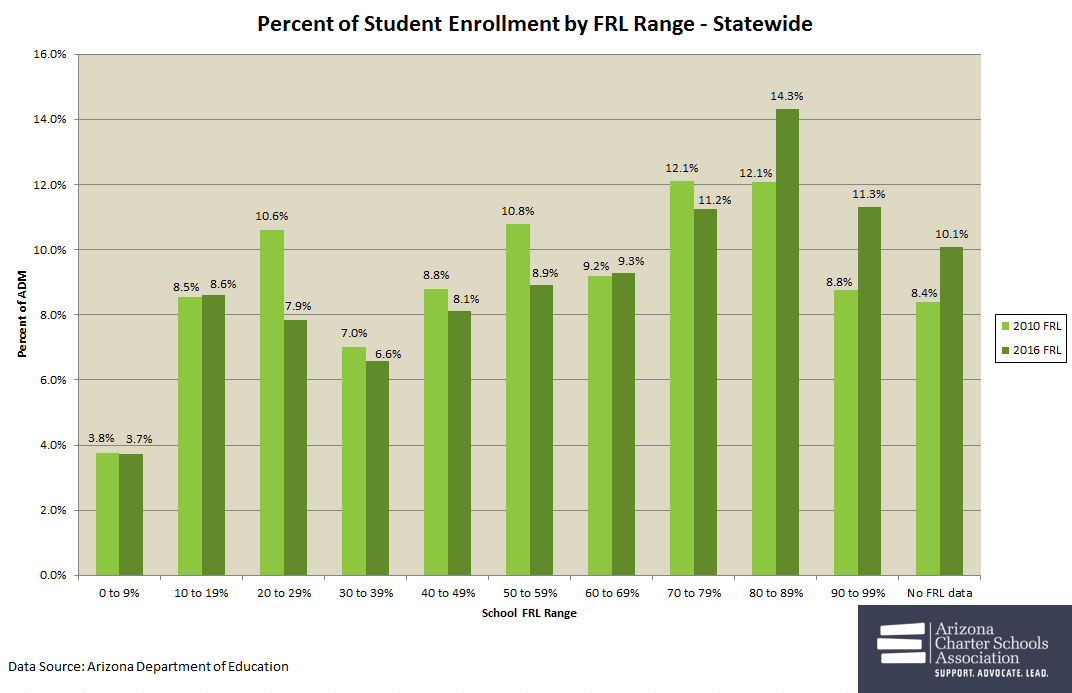
The degree of poverty increases from left to right; therefore, the farthest range – 90 to 99% – represents the most concentrated poverty, where nearly all students are eligible for assistance. The exception is the rightmost bar, which indicates the percentage of students enrolled in a school that does not have FRL data. Schools that do not participate in the program do not generate any data. There are varied reasons why a school might not participate in the program and exploring those reasons is outside the scope of this blog; here we will focus our attention on the trends for those schools that do report.
Statewide, we can detect a shift of the distribution to the right, meaning that a larger percentage of students are enrolling in schools with higher concentrations of FRL students. Beginning with the low-poverty schools, both the 0 to 9% and 10 to 19% schools have a relatively unchanged percentage of students. Schools saw declines in the percentage of students they enroll in the 20 to 29%, 30 to 39%, 40 to 49%, and 50 to 59% ranges. These students moved to the right of the distribution, into the 60% or more ranges. Combined, schools with 50 percent or more of their students eligible to receive FRL enrolled 53 percent of Arizona’s student population in 2010 and 55 percent in 2016.
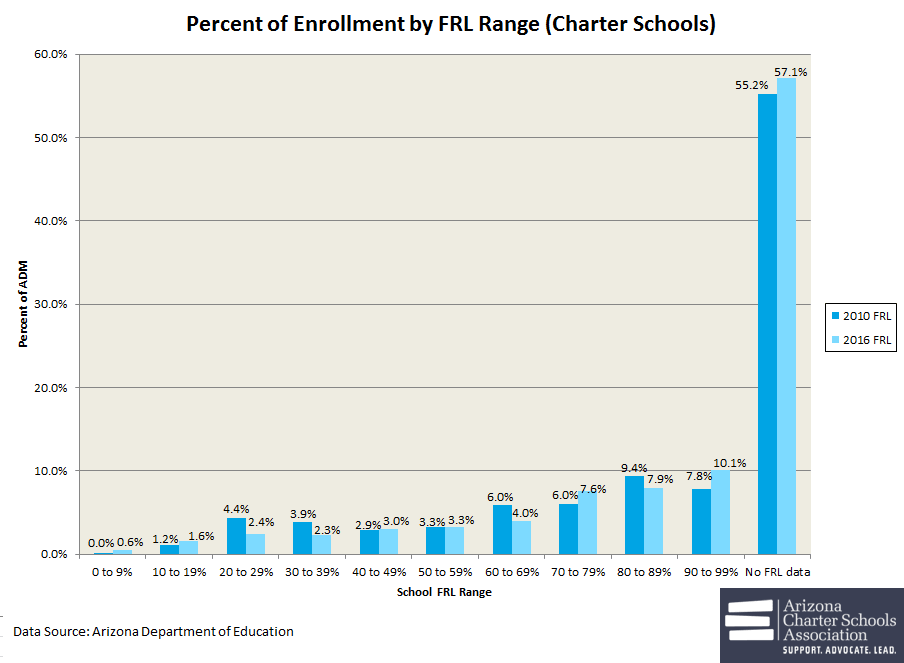
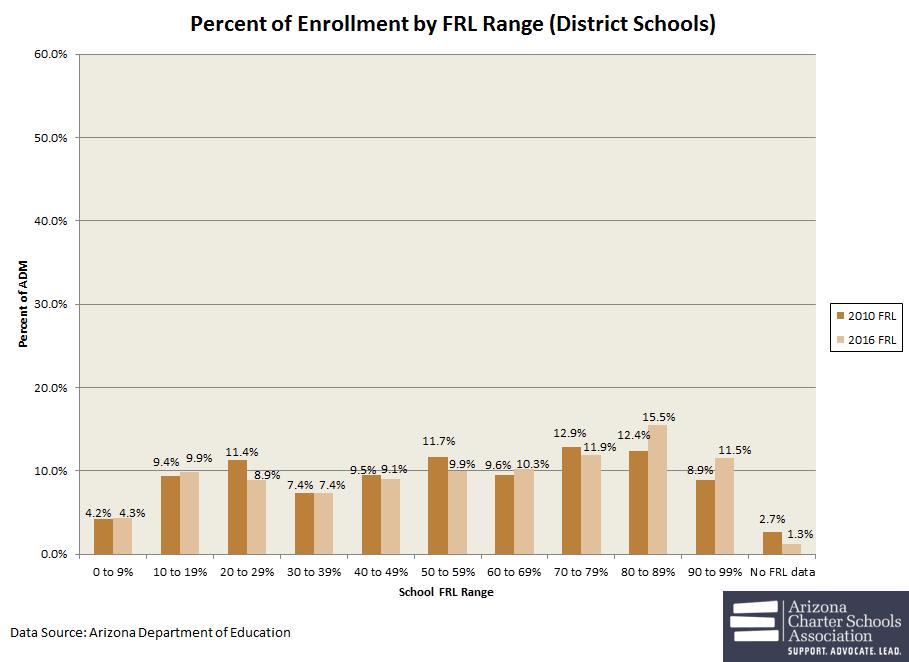
In addition to a statewide analysis, the Association analyzed the results by school type (charter/district). The most striking difference between the two groups is the disparity in the percent of students who are enrolled in a school with no FRL data. As shown below, a majority of charter students are enrolled in a school that did not report FRL data in 2010 or 2016, however, very few students in district schools are enrolled in a school with no FRL data.
Given that FRL information for over half of the students enrolled in charter schools is not available, charter results must be interpreted very cautiously. For those charter schools that do report FRL data, the distribution is moving slightly to the right. In 2010, 32 percent of charter students were enrolled with 50 percent or more FRL; in 2016, this grew to 33 percent.
The results for districts schools are consistent with the statewide trend. From 2010 to 2016, a greater percentage of students are enrolled in schools with higher concentrations of poverty, despite variability in the individual ranges. In 2010, over 55 percent of district students were enrolled in schools with 50 percent of more FRL; in 2016, this grew to 59 percent.
The Implications
Higher levels of poverty in our public schools translate to higher demands of our educators and on our limited resources. If the challenges to students and demands placed on schools increase as overall resources decrease, then the challenge for schools is multiplied. Recruiting and retaining high quality teachers, for example, becomes even more difficult at the same time that the need for them becomes even more critical to student success.
As the state looks to revamp its school accountability and funding systems, the relationship between poverty and measures of achievement must be properly addressed. School accountability labels that can be largely predicted based on the FRL rate do a disservice to the very schools with the biggest challenges[iv]. Our state funding and accountability policies should reflect the real challenges presented to schools serving students in poverty.
Additionally, any policy that takes poverty into consideration must examine how to deal with the significant lack of FRL data in the charter sector. This may include the need for additional data collection or information gathering before a policy can be effectively and appropriately implemented.
A Note on Data
Although determining why charter schools do not participate in the National School Lunch and Breakfast Program is outside of the scope of this blog, finding out the reasons may be important as the state moves forward with its K-12 funding revamp.
Footnotes/References
[i] http://www.azed.gov/health-nutrition/nslp/
[ii] https://www.gpo.gov/fdsys/pkg/FR-2015-03-31/pdf/2015-07358.pdf
[iii] http://www.azed.gov/health-nutrition/frpercentages/
[iv] See the Association’s paper, School Ratings: Improving the Data in Data Driven Decision Making, for a full explanation and recommendations.