Results of the 2015 AzMERIT testing data show that students in charter schools consistently outperform students in district schools, across all racial and ethnic groups. But does the higher student achievement lead to a closing of the achievement gap between different groups of students? The Association’s analysis shows that the differences in achievement of student subgroups within charter schools actually serves to widen the already large achievement gap.
CHARTER AND DISTRICT DEMOGRAPHICS[1]
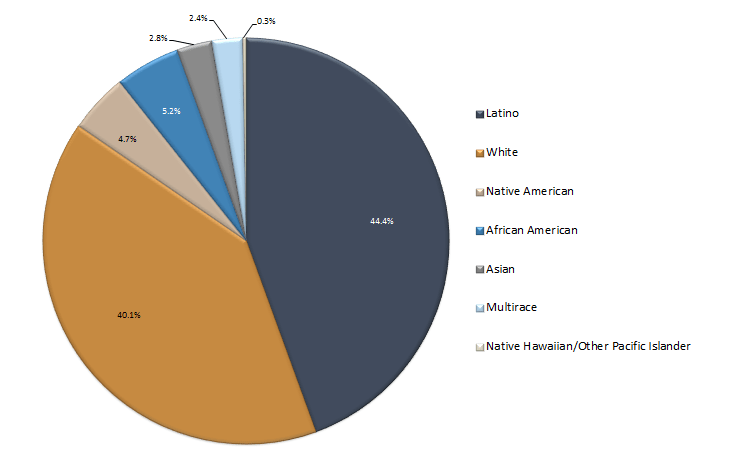
Figure 1 shows the racial and ethnic composition of all Arizona public schools during the 2014-2015 school year. Latino students comprise the largest group (44 percent) in the state, followed by White students (40 percent). The next largest group, African American students, is only slightly above five percent of the state, followed by Native American enrollment at slightly below five percent, with all other groups reporting fewer than five percent each.
FIGURE 1: DISTRIBUTION BY ETHNICITY IN ARIZONA PUBLIC SCHOOLS FY2015
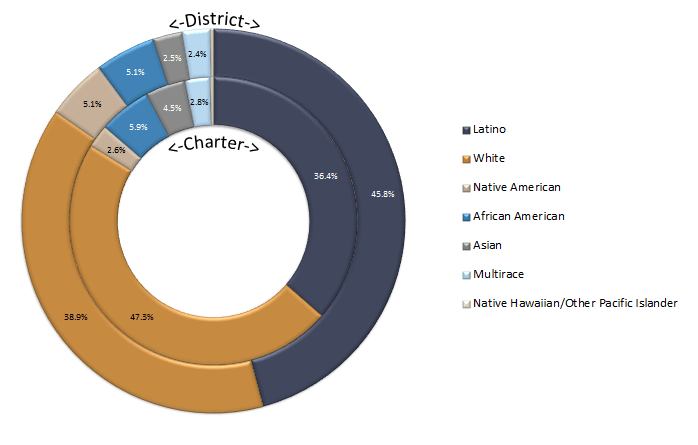
Figure 2 illustrates notable differences in the composition of district and charter school students. Charter schools serve a larger share of White students, 47 percent compared to 39 percent in district schools. Charters also serve a larger share of Asian and African American students than district schools. Conversely, charters serve a smaller share of Latino students, 36 percent compared to 46 percent in district schools, and a significantly smaller share of Native American students.
FIGURE 2: DISTRIBUTION BY ETHNICITY IN DISTRICT AND CHARTER SCHOOLS
These data suggest that White, Asian, and to a smaller extent, African American families are more likely to choose charter schools than other students and families. When evaluating these students’ overall academic performance, this decision appears to pay off.
AzMERIT RESULTS – THE CHARTER ADVANTAGE
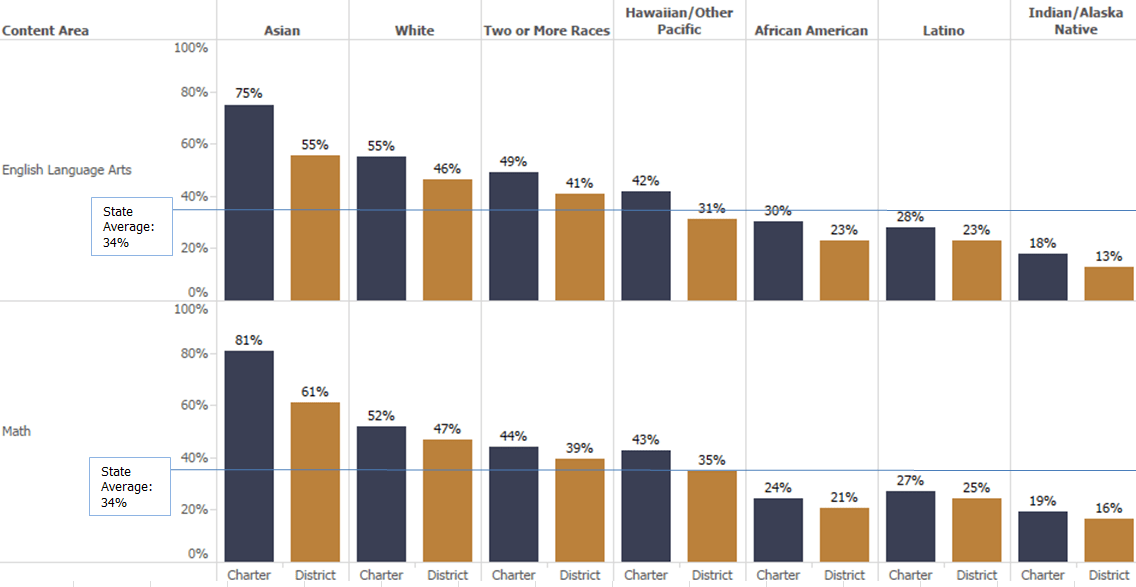
The figure below (Figure 3) shows the percent of students passing the AzMERIT exam in 2015, broken out by school type (district or charter) and student subgroup. These data combine the passing rates across grade levels in English Language Arts (ELA) and Math. In both content areas, charter students in all subgroups have higher passing rates than their district counterparts. These data demonstrate that charter schools are providing increased academic outcomes for the students enrolled – at least for the 2014-15 school year. For Arizona charter schools this is good news, given that a charter, by definition, is a contract to improve student achievement.
FIGURE 3: DISTRICT VS. CHARTER PASS RATES BY ETHNICITY ON 2015 AzMERIT
The charter advantage—the difference between charter and district performance—is particularly large for Asian students, a relatively small group of students in both sectors. Charter schools enroll a significantly higher percentage of Asian students than district schools and provide a 20 point pass rate advantage over district schools in both ELA and Math. The charter advantage for White students is also significant, nine points in ELA and five points in Math. We see a similar charter advantage for students from two or more races and Native Hawaiian/Pacific Island students. These four groups of students account for over 55 percent of charter enrollment; they are all scoring above the state average in ELA and Math and their results help explain charter schools’ overall performance.
Latino, African American, and Native American students also see a charter advantage, but a somewhat smaller one. Despite the gains experienced in charter schools, none of these groups perform at or above the state averages in ELA or Math.
AzMERIT RESULTS – THE ACHIEVEMENT GAP
The initial results indicate there is an achievement gap between districts and charters – where overall charter students are outperforming their district peers. The Association also wanted to investigate achievement gaps between subgroups of students within charters and districts. The table below shows achievement gaps within charters and districts for each of the major subgroups of students, in both ELA and Math.
For example, the ELA Asian/White achievement gap (the difference between the passing rates for these two subgroups in ELA) in charter schools is 20 percentage points compared to 9 percentage points in district schools. This means that the passing rate for Asian students in charter schools is 20 percentage points higher than their White charter peers, whereas Asian students in district schools outperform their White district peers by only nine percentage points.
FIGURE 4: ACHIEVEMENT GAP BY RACE/ETHNICITY AND SCHOOL TYPE
The most striking finding in this analysis is the relative size of the achievement gaps between subgroups, regardless of school type. With only two exceptions, all gaps are at least 20 percentage points. Of all groups, Native American students have the lowest performance in both ELA and Math, and have the widest achievement gaps compared to their peers. The Asian/Native American gap shows the size of the extremes.
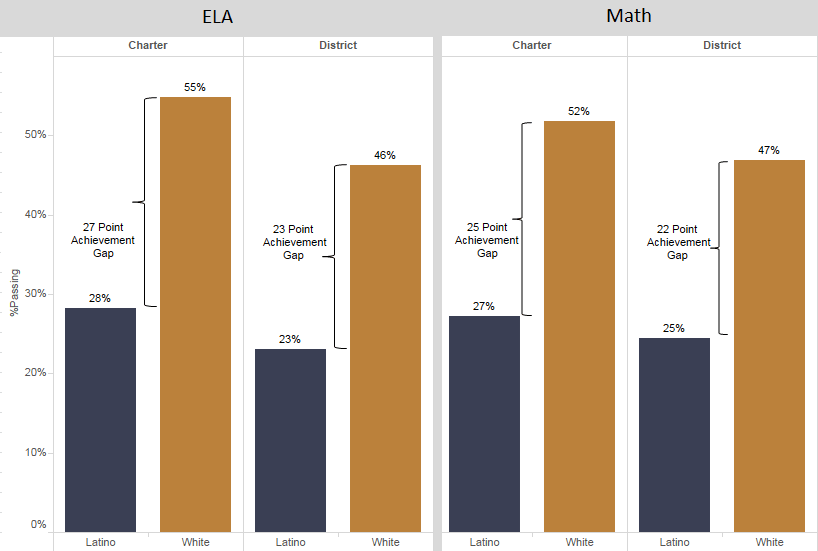
White and Latino students represent the two largest groups in the state and their achievement gap is illustrated in the figure below. Since the charter advantage for White students is greater than it is for Latino students (see Figure 3), the size of the achievement gap is greater in charter schools than in district schools.
FIGURE 5: WHITE/LATINO ACHIEVEMENT GAP BY SCHOOL TYPE
IMPLICATIONS
Policy makers are beginning to contemplate school accountability measures to evaluate the quality of Arizona’s public schools. The new A-F formula will include a combination of proficiency and growth measures. These data suggest that charter schools are likely to fare well in the overall evaluation when proficiency rates are compared to their district counterparts. The new A-F system must also integrate federal requirements to evaluate subgroup performance on AzMERIT and other indicators of school quality. The evaluation of achievement gaps in subgroups is a critical component in the identification of schools for targeted and comprehensive support (federal intervention). These data suggest that charter schools are likely to fare worse in the evaluation of achievement gaps, despite their overall higher performance.
In addition to accountability implications, these data raise questions about overall academic performance of student subgroups and ways that schools can close achievement gaps that exist among them. Clearly, the answer is not to reduce the rate at which Asian and White students are performing in schools. Rather, there needs to be a focus on replicating that same, or greater, performance for other student groups across all public schools.
FOOTNOTES/REFERENCES
[1] The Association used 2015 AzMERIT data for all public schools to evaluate their performance. The AzMERIT data provided were unredacted, through a research agreement with the Arizona Department of Education; these data included details for small schools and student groups that are not available in the publicly released data file. The demographic data included in these analyses were obtained from the October 1 Enrollment file for 2014-2015 (unredacted).


