Arizona’s fourth grade students led the nation in points gained on the National Assessment of Educational Progress (NAEP) science exam, according to results released this week by the National Center for Education Statistics.
While we found good news: Arizona is leading the nation in growth and reduction in the achievement gap between white students and Hispanic students, we also learned Arizona’s proficiency scores are still near the bottom in comparison to other states.
In looking at the Nation’s Report Card for Science, the Association examined the data in three important ways: overall growth from 2009 to 2015, the NAEP achievement gap, and national comparisons of proficiency.
Background
The National Assessment of Educational Progress (NAEP) has been measuring student achievement since 1969 and is the largest nationally representative and continuing assessment in the United States. Achievement results are produced for the nation, states, and some large, urban districts. Unlike AzMERIT and other state assessments, NAEP serves as a common measure of achievement that allows for comparisons of achievement to the nation and among states. NAEP does not report results for individual students.
Beginning in 2009, a new framework to guide the development of the test was used. The 2009, 2011, and 2015 assessments were developed using the same framework, allowing the results from only these three assessment years to be compared. These new frameworks were necessary, in part, due to the publication of National Science Education Standards[1]and Benchmarks for Scientific Literacy[2]. The NAEP science assessment measures students’ knowledge of: physical science, life science, and Earth and space sciences; and four science practices: identifying science principles, using science principles, using scientific inquiry, and using technological design.[3]
The NAEP Science exam was given nationally to fourth grade students in 2009 and 2015, and to eighth grade students in 2009, 2011 and 2015. The test incorporated students from district schools, charter schools, and private schools across the state. On average, a sample of approximately 100 public schools was selected within each state, and within each school, about 60 students were selected for assessment. Within a given state, the number of schools and the size of the student samples do vary somewhat depending on school size and the scope of the assessment given. Overall, each NAEP State grade level and subject area assessment relies on about 2,500-3,000 test-takers. Whole classrooms are not assessed – students are sampled from a roster of individual names. English language learners (EL) and students with disabilities (special education) are included in the sample and are provided accommodations according to a strict set of assessment administration guidelines.
Growth
The Association calculated the change in scale score from 2009 to 2015 to determine the decline or improvement for fourth and eighth graders by state. The interactive map below shows each state, colored by “improvement points” from 2009 to 2015. The dark green states improved a lot – Arizona leads the way with an 11 point improvement in fourth grade – while the light red states lost 1 or more points on their fourth grade scale scores. States that do not have data displayed did not participate in either the 2009 or 2015 NAEP Science exam. For more expansive NAEP data and full reports, head to the NAEP data explorer website [4].
Our second map shows the same data, only this time for eighth graders. Arizona gained 6 scale score points from 2009 to 2015, while Utah and Tennessee led the nation, gaining 9 points.
No state had more combined improvement points in fourth and eighth grade than Arizona. The interactive dashboard below combines the improvement points displayed in the first two maps, showing a scatterplot of each state that participated in the 2009 and 2015 NAEP Science test. The vertical axis represents growth in the scale scores of fourth graders from 2009 to 2015, and the horizontal axis represents the same for eighth graders. Hover over each circle to see state level details.
Achievement Gap
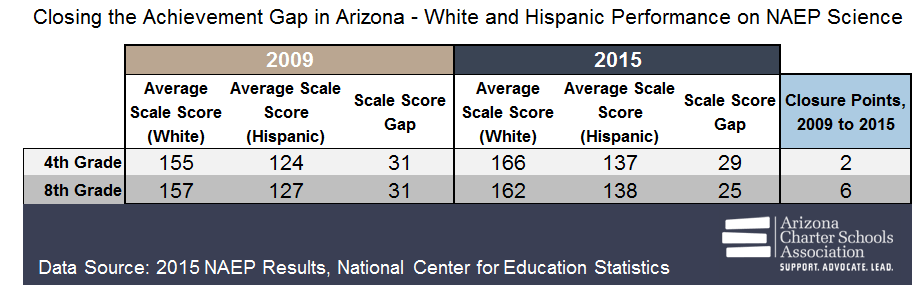
Arizona made progress in closing the achievement gap between white students and Hispanic students, especially in eighth grade where the gap between these groups dropped from 30 points in 2009 to 24 points in 2015. The six-point closure of the white-Hispanic achievement gap made Arizona one of only 12 states to close the gap by more than five points in eighth grade science. The reduction of the fourth grade science gap was more modest, with Hispanic students gaining only 2 points compared to their relative standing in 2009. Given the changing demographics of Arizona’s student population, increasing numbers of Hispanic students, these findings are significant. The following table summarizes the closure of Arizona’s white-Hispanic achievement gap from 2009 to 2015 for fourth and eighth grade science:
Proficiency
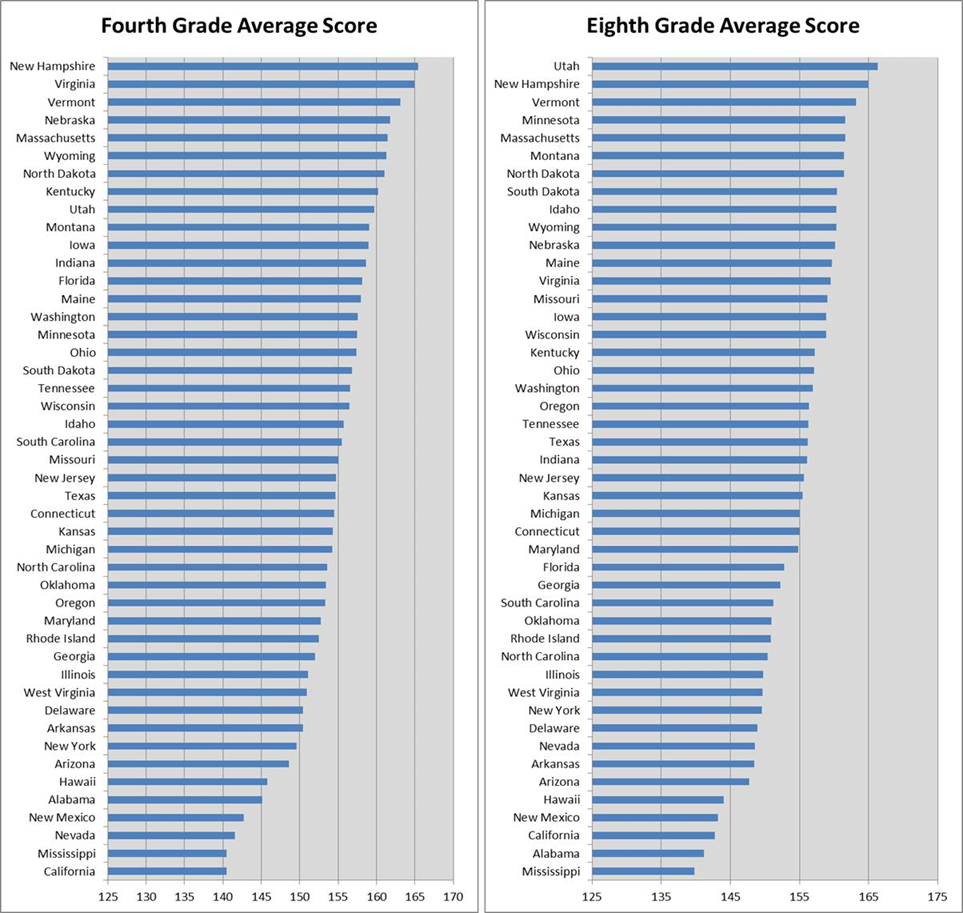
While there were some positive notes to come out of the NAEP Science data, especially with regards to student achievement growth from 2009, Arizona still has room to improve in overall proficiency as a state. The fourth grade scores ranked 40th and the eighth grade scores ranked 41st in the nation, with states like Utah, Vermont and New Hampshire leading the way in proficiency. The graphs below show the results in fourth and eighth grade average score, ranked by state. Arizona can be found towards the bottom, with fourth graders having an average score of 149 and eighth graders scoring a 148.
What Does This Mean?
While Arizona has room to improve its overall performance on NAEP, leading other states in improvement scores means that Arizona in on the right track. An important factor in increasing overall performance will be the continued narrowing of achievement gaps. Based on these data, it is clear that Arizona is effectively impacting outcomes for all students: the achievement gap is narrowing and the overall scores for the state are improving.
Given Arizona’s science standards were last updated in 2005[5] our improvement scores on NAEP aren’t due to stronger alignment between our standards and the new testing framework. The poor alignment of our science standards to NAEP is likely a significant contributor to Arizona’s overall proficiency rate and subsequent ranking. However, given our improvement scores, something must be happening in Arizona’s public schools. Perhaps we can attribute our improvement in science to the implementation of more rigorous English Language Arts and mathematics standards, adopted initially in 2010 and revised in 2016. Fourth grade testers in 2015 were fully exposed to increased rigor of the new standards as well as the inclusion of more informational (non-fiction science and social studies) text. Therefore, it’s plausible that our students are applying critical thinking and problem solving skills developed in these other content areas to science.
If that’s the case, Arizona has an opportunity to capitalize on this momentum with the adoption of new, more rigorous science standards. Arizona is just beginning the standards review process for science. As with the adoption of more rigorous English Language Arts and mathematics standards, this decision and the subsequent implementation timeline will likely impact future NAEP results and success of Arizona’s students.
Footnotes and References
[1] National Research Council (1996). National Science Education Standards. Coordinating Council for Education, National Committee on Science Education Standards and Assessment. Washington, DC: National Academy Press.
[2] American Association for the Advancement of Science (1993). Benchmarks for Science Literacy. New York: Oxford University Press.
[3] NAEP Science Framework Overview http://nces.ed.gov/nationsreportcard/science/whatmeasure.aspx
[4] http://nces.ed.gov/nationsreportcard/naepdata/dataset.aspx
[5] Arizona Academic Standards webpage: http://www.azed.gov/standards-practices/