
Arizona’s students identified as English Language Learners are declining on crucial achievement measures since 2000, and are faring worse than their counterparts in neighboring border states of California, New Mexico and Texas.
This blog is Part Two of our series that explored significant events and trends in the education of Arizona’s English Language Learners since the Flores Consent Decree of 20001. In Part One, we diagrammed recent Arizona-specific achievement measures, as well as a timeline of important English Language Learner events.
In this month’s blog, we look at English Language Learner (ELL) student achievement over time and across the region of border states – California, New Mexico, Arizona, and Texas. Our research suggests the following:
- Unlike California and Texas (and New Mexico to a lesser degree), Arizona has seen a decline in the percentage of ELL students over the past decade. Since 2005, Arizona’s identified population of ELL students has declined from a high of nearly 20 percent to just over 5 percent (in the most recent release of October enrollment numbers)2. Read the full findings reported in Part One.
- All four states have gaps in reported ELL data that are suspect; the greatest disruption in the data for all four states appears around 2007.
- A double-digit achievement gap, as measured by scale scores on the National Assessment of Education Progress (NAEP), exists between ELL and non-ELL students, has become more severe in the past decade. Arizona’s gap between ELL and non-ELL students is the most significant of the four states’, and it is getting worse.
Border States and Their Data
Cultural issues along the US/Mexico border region, not the least of which includes business climate, immigration and language politics, have been contentious for decades. A broad range of policy matters specific to the border region have become even more heated since Flores. Arizona policy has made its own unique contributions (including Proposition 300, which limited public program access, and the controversial SB 1070 which added a broad set of immigration enforcement policies), but other states have waded into public policy matters highly impactful to the region. Arizona’s Proposition 203 (an English-only proposition) is recognized as a re-branded version of an initiative that passed in California: California Proposition 227. This November, California overturned 227 with passage of Proposition 58. Interestingly, Texas and New Mexico have laws enshrining bilingual education as the preferred models in those states3.
For context, the states along the US/Mexico border (Arizona, California, New Mexico and Texas) are a natural cohort for examining English Learner policies because of the similar demographics and common concerns. The Common Core of Data collected by the U.S. Department of Education annually provides a source of basic enrollment information for schools in this target group. The figure below diagrams the percentage of ELL students within each state since 1999.
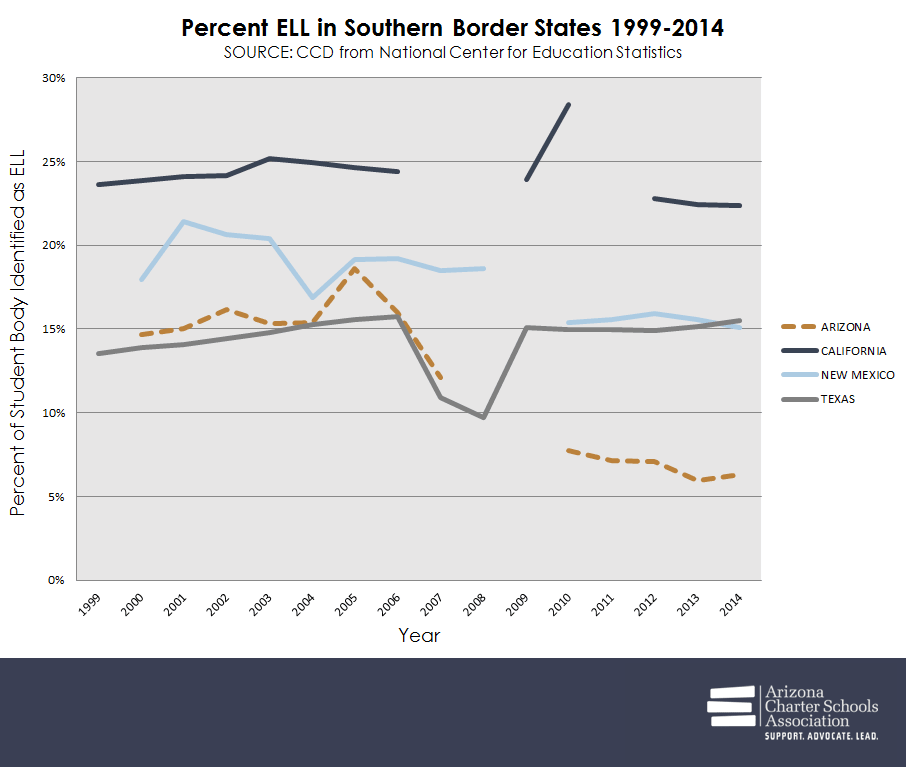
Arizona’s decline in the number of ELL students stands in contrast to growing trends in these data among other states within the Southwest region. Though all states suffered the “Great Recession” and saw changes to the construct of “English language proficiency” with changes to Title III4, Arizona uniquely saw a dramatic decline in the number of students identified as ELL in the region. All four states seemed to start the new century with common challenges and somewhat similar trends in ELL membership, which splintered and diverged in the past decade. For a full description of these data, please read Ever Since Flores: The History of English Language Learners in Arizona (Part One of this blog).
In addition, the above graph contains clear fractures, holes, and possibly even suspect variations in the data. Examinations of other student characteristics for the border states, such as percentage of students with Individualized Education Plans, or those who live in poverty, resulted in similarly curious information. For this blog, the Association reached out to the National Center for Education Statistics for guidance on how to work with potentially erroneous published data and they sent a statement5 that illuminates how errors occur in these data. Despite efforts to create comparable state level data, it is apparent that the federal data should be considered with some skepticism and interpreted with caution.
ELL Achievement on National Assessments
To compare changes in ELL student achievement across the region, we turn to the National Assessment of Educational Progress (NAEP). Individual states’ assessment results are inadequate for this task, as they lack consistency over time and comparability between states. Though NAEP is administered to a limited sample of students in each of our target states, ELL students are included in the sample and are provided a standard and consistent set of accommodations, according to assessment administration guidelines.
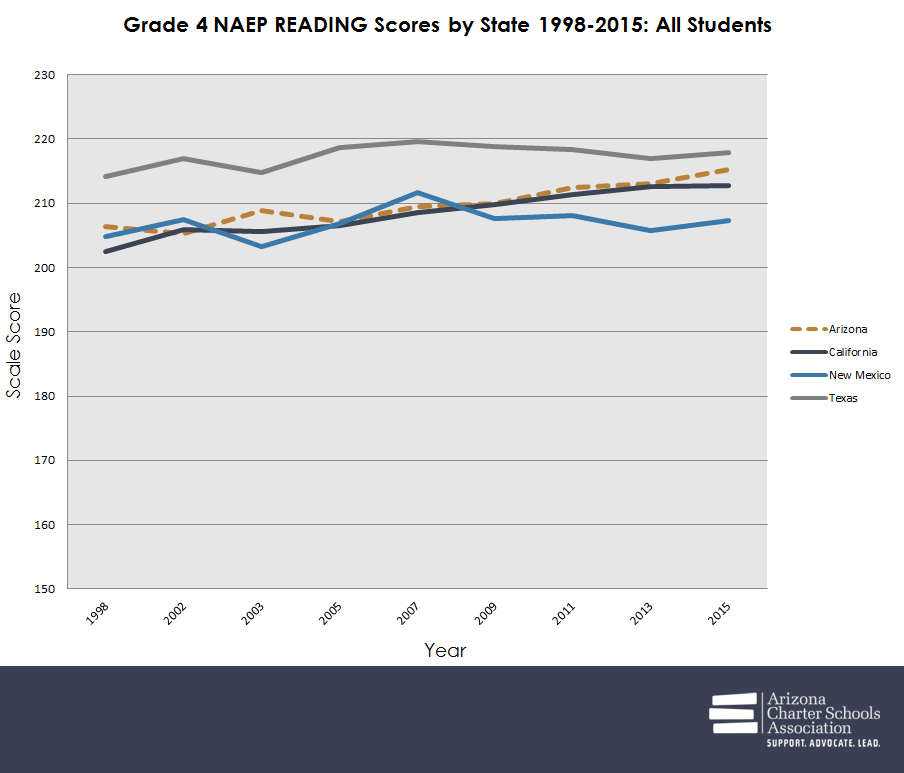
The figure below shows grade 4 reading scores for ALL students in our cohort of states, 1998 to 2015. Arizona and California have made steady and impressive gains since the turn of the century when considering students from all backgrounds.
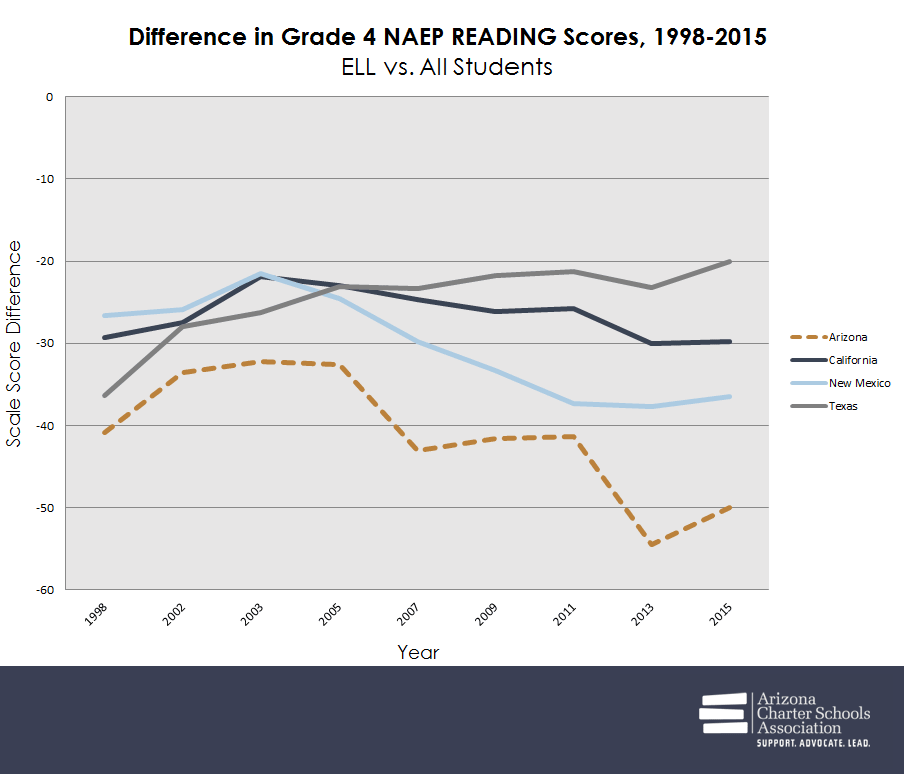
However, the difference in scale scores between students identified as English Language Learners and all students sampled by NAEP in each state is shown for the same time frame in the figure below. These data indicate that ELL students are scoring significantly lower than their English-proficient peers in all four states, with Arizona having the greatest gap between the general student body and ELL students; not only that, but the difference has become more severe in recent years. Only Texas has seen a declining gap in the region for ELL students in grade 4 on the NAEP reading test. In 2015, Texas saw only a 20-scale score point gap where Arizona had a 50-point gap between English Language Learners and the general student body.
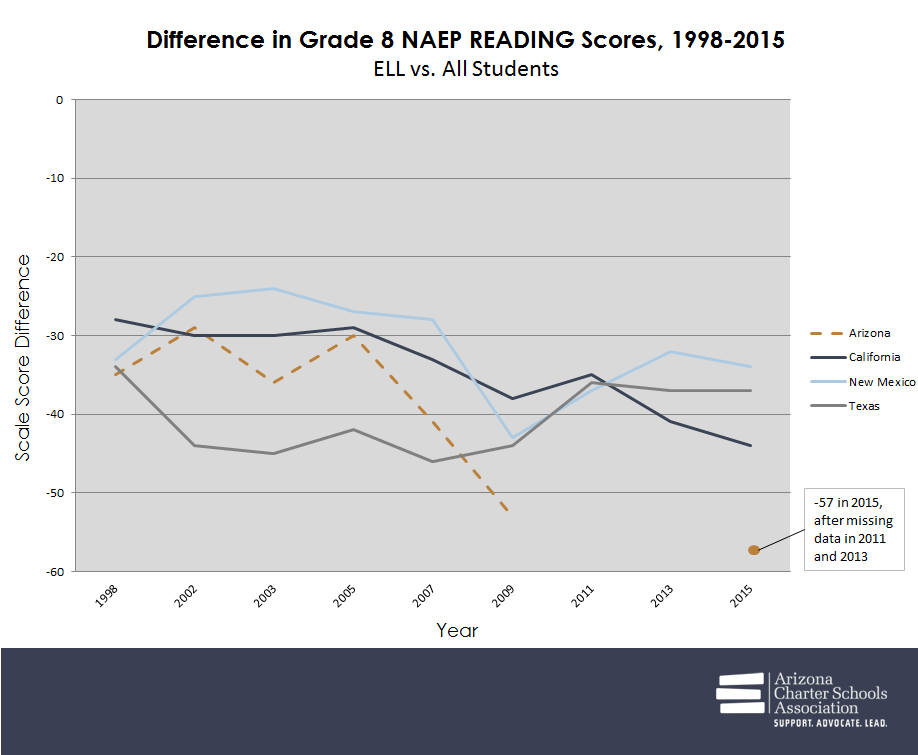
The data for the grade 8 reading score gap is similar, though with a few exceptions. Arizona, again, dropped to the bottom of the cohort for the border region, with the decline starting in 2005 (the year the Arizona English Language Learner Assessment was implemented). No data were available for Arizona grade ELL students in 2011 and 2013, due to sparseness in the data. This corresponds to the precipitous decline in the number of ELL identified students in the state (see the timeline in Part One). By 2015, a 57-scale score point gap existed between English Learners and all students on the grade 8 reading scores in Arizona. Whereas, grade 8 ELL students in Texas and New Mexico ended up in 2015 about where the ELL student population started in 1998.
So…How Have Arizona’s ELL Students Achieved Since Flores?
In Horne v. Flores, the United States Supreme Court case that settled the Flores case, Justice Alito wrote for the majority:
…The question at issue in these cases is not whether Arizona must take “appropriate action” to overcome the language barriers that impede ELL students. Of course it must. But petitioners argue that Arizona is now fulfilling its statutory obligation by new means that reflect new policy insights and other changed circumstances.6
The “new means” alluded to by Justice Alito include teaching English through a structured, four-hour block of English-only immersion. With little achievement evidence presented, the Court ruled that Arizona had overcome the barriers for ELL students. Really? All data sources considered in this blog indicate that Arizona’s students identified as ELL have declined on crucial achievement measures since 2000, and fare worse than their counterparts in neighboring border states. Quite possibly (even likely), the relative poor showing of Arizona’s ELL student body in achievement test and graduation rate data is an artifact of a change in identification and assessment procedures to some degree. Others have attributed the relative poor showing of Arizona’s ELL students to other factors, including the four-hour English language development block. Regardless, progress-monitoring set forth in the Flores Consent Decree no longer appears in public data sources, so the degree to which reclassified students are thriving or languishing across Arizona is unreported, and possibly unknown.
Footnotes and References
[1] In 1992, Flores v. State of Arizona was filed in federal district court alleging the civil rights of Limited English Proficient students enrolled in the Nogales Unified School District were violated. See more at http://www.azleg.gov/briefs/Senate/FLORES%20V%20ARIZONA.pdf
[2] http://www.azed.gov/research-evaluation/arizona-enrollment-figures/
[3] See http://www.ped.state.nm.us/BilingualMulticultural/dl08/Article23-BilingualEducationLaw.pdf and http://www.statutes.legis.state.tx.us/Docs/ED/htm/ED.29.htm#B
[4] English language arts content standards and the notion of EL students being proficient in “academic language” change the nature of what language proficiency assessments were measuring, as detailed in http://ell.stanford.edu/sites/default/files/pdf/academic-papers/08-Bailey%20Wolf%20Challenges%20of%20Assessment%20Language%20Proficiency%20FINAL_0.pdf
[5] In an email from NCES, the following explanation regarding data accuracy was provided. “The CCD depends on state education agencies to provide us data. Not all states can provide us data in all years. Changes in state policies (e.g., eligibility for particular programs) can result in large changes in student counts. Additionally, since these counts are reported at the LEA level, the lack of data for a single, large LEA can also cause a large fluctuation in the reported counts. We run edits checks for these, and we question the states when we find issues. If the states provide an explanation, we include that in the state notes section of the file documentation. But very often the states have no explanation.”
[6] 557 U. S. Supreme Court Ruling, Horne v. Miriam Flores (2009)