As the debate over a new accountability system for Arizona rages on, alternative schools across the state are facing the unknown for how their educational philosophies and outcomes will be measured in the years to come. Alternative school accountability methods are anticipated in August 2017, but who are these alternative schools, and whom are they serving? This month, the Association examines these Arizona schools that often go overlooked, and their role in the state education system moving forward.
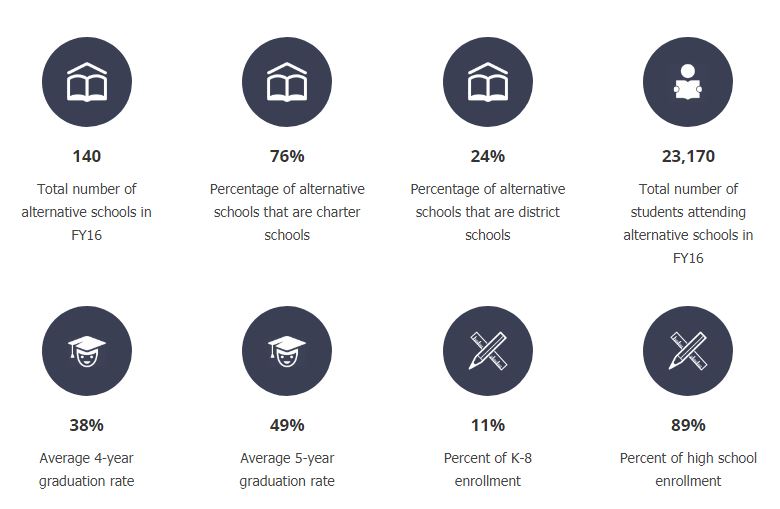
Our research shows two notable facts: (1) from 2012 to 2015, alternative schools – both district and charter – have seen rising four- and five- year graduation rates, and (2) the number of alternative schools and number of students enrolled in alternative schools have declined since 2012 by 18% and 16%, respectively.
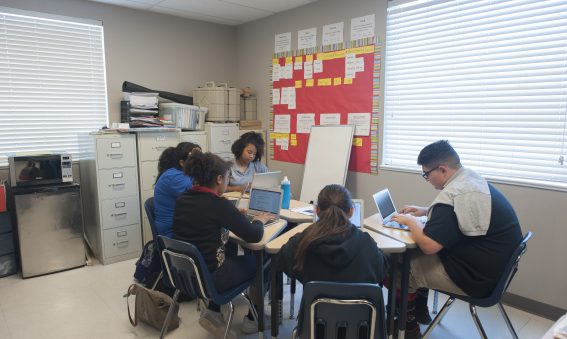
WHO ATTENDS ALTERNATIVE SCHOOLS?
Alternative schools are defined as schools that serve specific populations of at-risk students. “At risk” is defined in statute as a student who meets any one of six categories- documented disruptive behavior, dropout, struggling academically, adjudicated, primary care giver or ward of the state. In addition, it is estimated that alternative schools – which are predominantly charters – serve a higher percentage of racial minorities, English language learners, free and reduced lunch populations, and special education students than the state average.
Although 43 states and the District of Columbia have formal definitions of “alternative education,” there are significant variations across state borders. Some states’ alternative schools offer regular instruction, social skills support, career education, or behavioral services, while others’ do not. In general, though, alternative education programs are developed to serve students who are unable to benefit from “traditional” school programs; this can include those with behavioral problems, those who have dropped out, or those with chronically poor attendance.
Arizona has its own set of rules as to who an alternative school is meant to serve, which includes students who are more than one year behind in academic credits, adjudicated students, or students who have dependents. A full definition of Arizona alternative schools and school populations can be found here. Arizona schools must request Alternative School Status through the department of education, and adhere to guidelines set forth by the state.
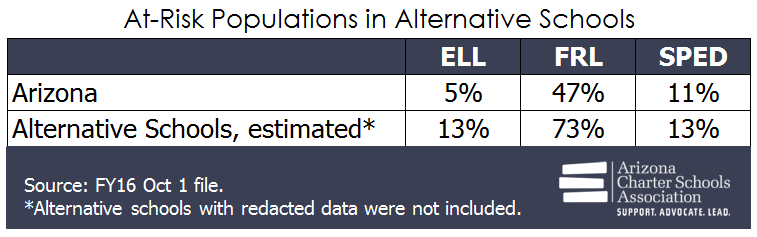
In line with the very mission of alternative schools, it follows that compared to statewide averages, a higher percentage of at-risk students are being served by alternative schools.
At-Risk Populations in Alternative Schools
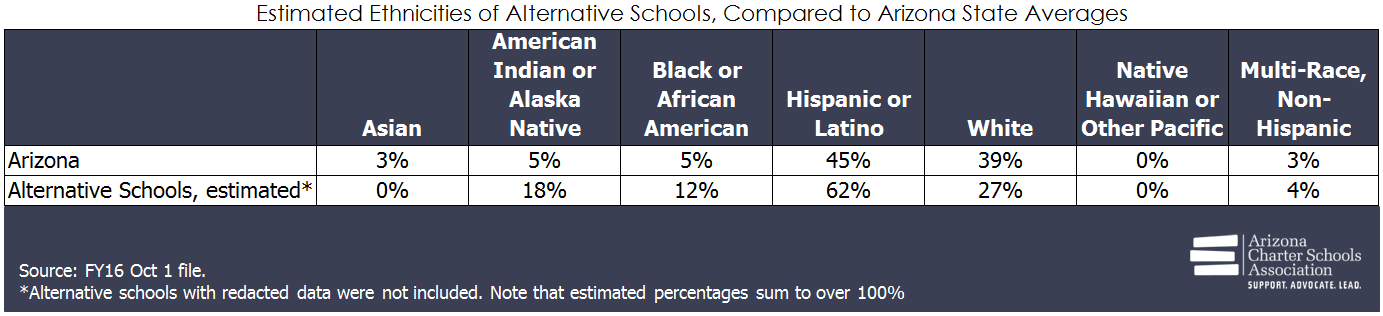
In addition, the Association estimates that alternative schools are serving a higher percentage of black and Latino students than the state average, but a lower proportion of white students than the state average. Due to the often-small populations within alternative schools, much of the data regarding race and ethnicity was redacted from pubically-available files. The below table represents an estimate of alternative school composition, based on available data.
Estimated Ethnicities for Alternative Schools, Compared to Arizona State Averages
TRENDS IN ALTERNATIVE SCHOOLS
In the past five years, the number of alternative schools in Arizona has been declining, along with enrollment. Interestingly, the number of charter alternative schools has stayed relatively stable during the time period, while a reduction in the number of district alternative schools has fueled the waning trend within the sector. This phenomena may be partially explained by the Arizona Department of Education’s alternative school application process which began in 2014 and required both a formal application, verification and auditing of student data. It is unclear whether the decline is a function of rejected or reduced applications to the state.
The enrollment data for alternative schools looks similar to the above graph; there were close to 30,000 alternative students in FY12, but that number has since fallen to 23,170 in FY16.
It should be noted that from 2012 to 2015, alternative schools – both district and charter – have seen rising four- and five- year graduation rates. The department of education reports graduation rates over the span of four to seven years for each cohort of potential graduates that enter high school within a given year. That is, students can be reported as graduates in four years (most typical), five, six, or even seven years. The difference between four-year to seven-year graduation rates is an especially critical difference for alternative schools, who often work with former dropout students or students with dependents. For the purposes of this blog, the Association examined four- and five-year graduation rates within alternative schools[1] over the past four cohorts of incoming high schoolers. We found that for the 2015 cohort, an average alternative school graduated 38% of its eligible students in four years. Given that same cohort, though, alternative schools, on average, had graduated 49% of their students over the course of five years. The below graph shows how average graduation rates in alternative schools have increased over time for all alternative schools:
WHAT IS NEXT FOR ALTERNATIVE SCHOOLS?
The A-F letter grade accountability system for public schools, including alternative schools, was put on hold after the 2014 results. Alternative schools are subject to different performance criteria than traditional schools; their accountability labels also differentiate them as alternative schools, i.e., “A-ALT” or “B-ALT”. The 2017 A-F accountability systems will continue evaluating traditional and alternative schools separately. Given the relative number of alternative schools it’s not surprising that little time has been spent on the development of the alternative school framework.
In terms of alternative schools in the larger educational landscape, it’s interesting to see the potential impact that an accountability policy decision (application and enrollment audits) had on both quantity and quality of a particular school type. These data suggest that a corresponding reduction in the number of alternative schools positively impacted the overall quality as measured by increased graduation rates. Is it this simple? Could a straightforward application and student enrollment audit weed out poor performing schools? Certainly, these data can’t confirm this hypothesis but it does beg the question.
Footnotes and References
[1] Data on six- and seven-year graduation rates is currently not posted on ADE’s website. The Association reached out to the department of education for the data, and as of this blog’s press time, the data had not been obtained.