The Association believes education leads to opportunities in life, and we work hard to make data transparent and actionable. As we look at Arizona’s A-F accountability system, we are asking whether our students are in quality seats.
For our purposes, a student is enrolled in a quality seat if they attend a Tier I school (A or B rating). At the end of the day, we want to be able to measure the change in the number of quality public school seats available for students across Arizona — district and charter.
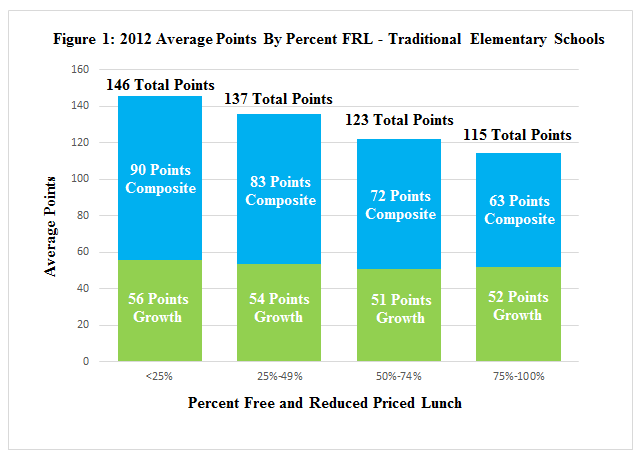
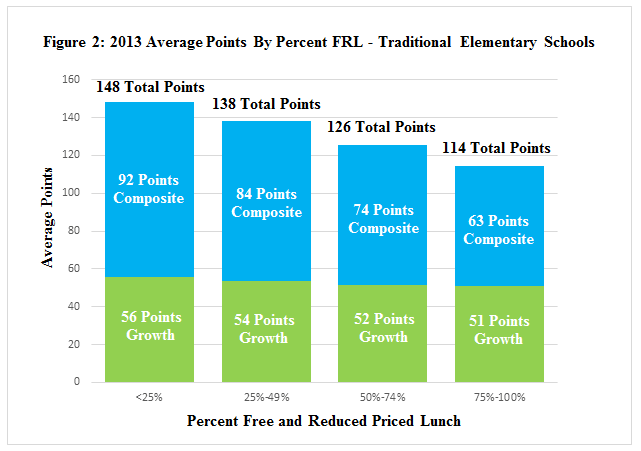
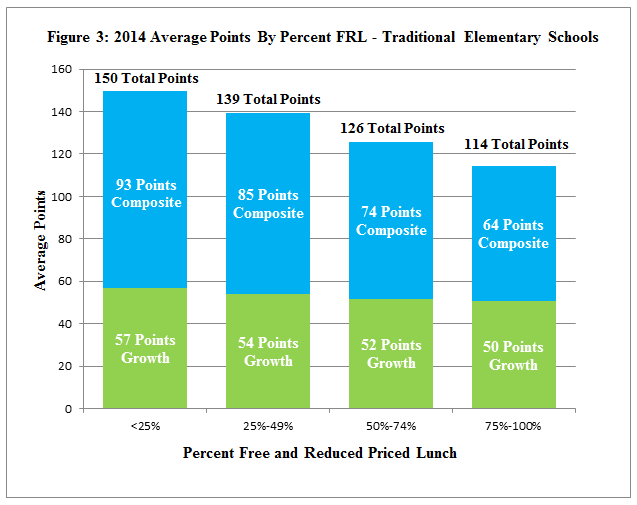
As the Association has pointed out in several of our publications, the relationship between poverty and measures of student achievement has long been a limitation of measurement of student achievement in education. The challenge for Arizona’s accountability model is to adequately control for the effect of poverty on the final school rating. As we noted in our publications, despite the inclusion of the student growth percentiles, the A-F model still has limited use in portraying school quality due to its failure to adequately control for the effects of poverty and fairly measure a school’s contribution to learning. However, all those issues notwithstanding, we still believe analyzing these data will provide insight into Arizona’s current accountability system.
A-F data published by the Arizona Department of Education in August indicates an overall increase in the percentage of A and B rated schools, with nearly 2 out of 3 schools achieving these results (62 percent of schools were rated A or B in the traditional model). To put this number in context, in 2012 54 percent of schools were rated A or B, in the traditional model. While it’s important to see the numbers of schools improving, we wanted to take a closer look at the number of students impacted by these improved letter grades. In order to do this we designated each school into one of three tiers based on their A-F letter grade. Tier I represents all schools receiving an A or B rating; Tier 2 are C rated schools, and Tier 3 are schools earning a D or F rating.
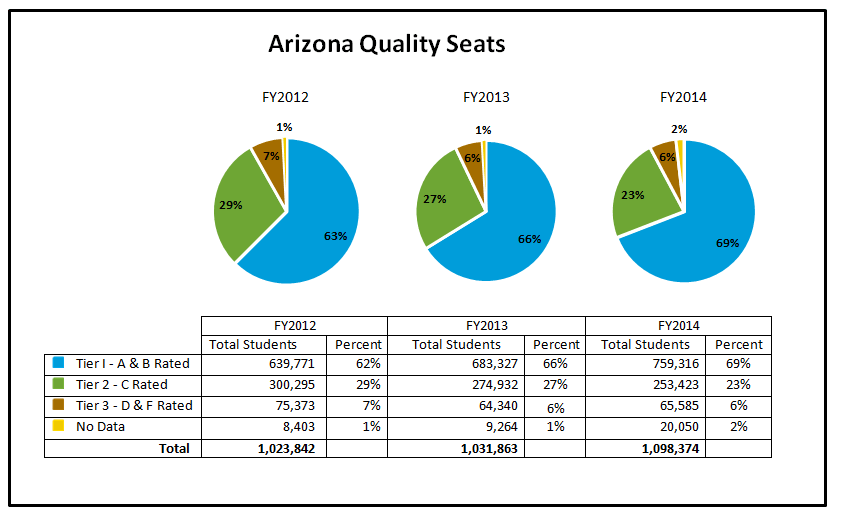
We analyzed the data from the past three years of A-F accountability results to evaluate the trends in the number of quality seats. The following tables present the data for all public schools — district and charter — in each of the past three years. The number of students and the percentage of their enrollment is reported annually. The data show, as expected given the overall increase in the number of A and B rated schools, a larger number of students are enrolled in a quality seat in 2014 (69 percent) as compared to 2012 (62 percent). As the number of Tier 1 seats increased, the number of Tier 2 and Tier 3 seats decreased, demonstrating an overall improvement in the number of seats available across Arizona. However, an alarming number of seats are not rated in 2014, more than double the number in 2013. It should be noted that the Arizona Department of Education has not yet finalized the “pending” schools which account for a large number of these seats without data.
These data present an alternative lens to evaluate the impact of Arizona’s school accountability measure. Certainly, these results are affected by countless school improvement decisions at the classroom, school, LEA and state level (including the work of the Arizona State Board for Charter Schools). No matter the decisions being made, these data make it clear that, at least according to our A-F results, more of our students are enrolled in a quality seat now than in 2012 when we started.