The public school tax credit began in 1997 with the passage of HB2047 which was an innovative option for Arizona taxpayers to donate a portion of their income to public schools in return for a credit towards their state income tax. Individual donations are capped at $200 (or $400 for those filing jointly) and can be used by public schools only for extracurricular activities, such as the purchase of band instruments or sports equipment, and character building programs, such as Character Counts. Tax credit donations may not be used to pay for core instructional or operational needs, such as instructional materials, teacher salaries, or building maintenance.
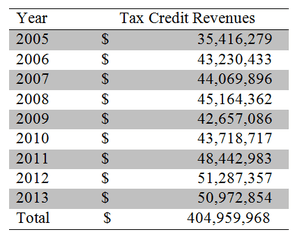
Originally estimated to cost the state “$3.9 million beginning in FY 1998-1999,”[1] tax credits have become a significant source of revenue for Arizona schools, totaling over $400 million in the last nine years. Table 1 shows tax credit revenue to public schools in each year from 2005 and 2013. Despite slight decreases during the Great Recession, the total amount has increased from $35.4 million in 2005 to nearly $51 million in 2013.
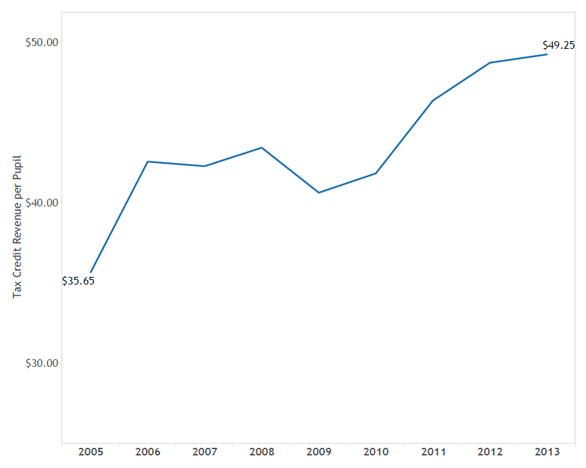
o account for changes in the student population, Figure 1 shows revenues per pupil over the last nine years. This too shows the per pupil amount increasing overall during this time period, despite small setbacks during the Great Recession.
This is Part I of the Association’s four-part series on Tax Credits. Find Part II here, Part III here, and Part IV here.
DATA AND METHODOLOGY
The primary data for this blog series consists of school-level tax credit amounts reported by schools for years 2005 through 2013. These files were obtained from the Arizona Department of Revenue [2] and include the total number of donations a school received, the total dollar amount received, and the total amount spent for each year. Additionally, for years 2011-2013, these files contain information about tax credit expenditures by category. To enhance our understanding of school-level characteristics, we linked the tax credit data to enrollment [3] and poverty data [4] obtained from the Arizona Department of Education.
The Department of Revenue collects data from each public school in the state and in most cases the data are reported for each school. In some cases, the data are reported as aggregated district amounts. For our analyses, we utilized all data reported, whether by district or by school, for all state summary tables and graphs. Where our analysis required school-level information, the district-level cases were omitted.
While the tax credit may be taken for either a general contribution or for fees, the Department of Revenue data does not draw a distinction. As a result, there is no way to know whether the amounts schools receive are donations that can be used at the discretion of the school, or whether they are in the form of fees that are, in practical terms, earmarked for a particular student.
For our expenditure analysis, we took each expenditure category listed in the tax credit file and summed them across schools to determine a statewide total expenditure by category. Because several categories listed in the tax credit file overlap (i.e. “sports” and “athletics”), we chose to combine them. These categories are athletic and sports programs, fine and performing arts, extended day and summer programs, cheerleading and rifle team, and driver’s education programs.
Footnotes:
[3] Average Daily Membership Reports available at http://www.azed.gov/finance/reports/#SafrTop
[4] Percent of students who qualify for the National School Lunch Program, available http://www.azed.gov/health-nutrition/frpercentages/