
Continuing our look at Arizona’s public school tax credits, Table 2 shows the statewide trend in the number of contributions and the average contribution amount. A contribution may be a single person or a couple, so the number of contributions does not precisely reflect the number of taxpayers who are using the tax credit, but it does provide a useful indicator of the change in the level of taxpayer participation. To put this number in perspective, in 2012, Arizona residents filed over 2.7 million state income tax returns [1], suggesting fewer than ten percent of filers are using public school tax credits.
Table 2: Number and Average Contributions, 2005-2013
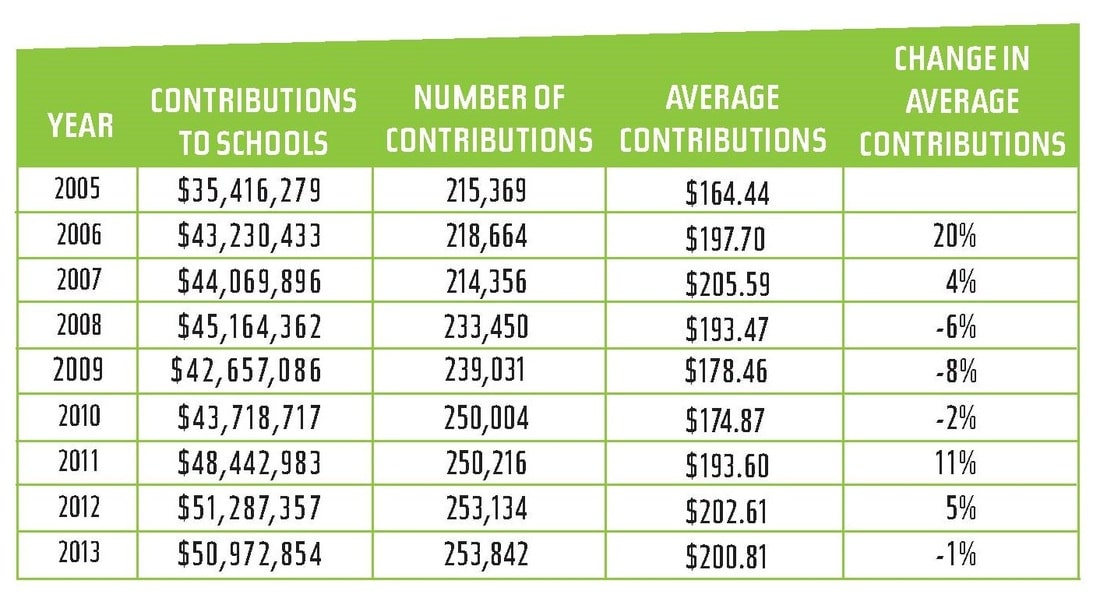
The number of contributions increased a total of 18% from 2005 to 2013. This rate is less than half of the 44% increase in the total contributions received by public schools in these years. This can be explained by the fact that the average contribution amount increased 22% during the same period of time, although it did fluctuate somewhat during these years. In other words, more people are contributing larger amounts of money.
It should be noted that the taxpayer may take the tax credit for a donation to a public school or for the payment of fees associated with a student’s extra-curricular activities. For example, a parent may make a $200 contribution to support a school’s athletic programs and take a $200 tax credit, or she can pay $200 in fees associated with her child’s participation in the school’s basketball team and take the same $200 tax credit (or a combination, within the allowable limits). Available data do not allow an analysis of what proportion of contributions are made as donations or fees.
Summary
Trends show that more taxpayers are using public school tax credits and schools are the recipients of an increasing amount of dollars, both in total and on a per pupil basis. Their popularity is likely due to key features of the program that are attractive to the taxpayer — a dollar for dollar credit on state income tax and the ability to target dollars for the benefit of a particular school or, in some cases, a particular child.
Tax credit contributions are appealing to public schools that have experienced significant budget cuts as a result of the state’s poor economy and legislative action. Anecdotal evidence suggests that these increases may also be due to a greater public awareness of the tax credit brought about by a higher level of effort on the part of schools to raise that awareness and solicit funds.
Given that there is no cap placed on the amount of total dollars that a school may receive and the low rate of taxpayer participation to date, it is reasonable to expect that these trends will continue on their upward trajectory. While the benefits and appeal to the taxpayer are undeniable—a dollar for dollar credit on the state income tax plus the ability to target the contribution—the broader effects of this policy are worth considering.
Footnotes