 The Pacific War reached a point in which a battered USS Enterprise stood as America’s only operational aircraft carrier. Undaunted, the crew hung a banner in the flight deck that stating, “Enterprise vs. Japan” and kept on fighting. Arizona’s charter leaders may feel a bit under assault by circumstances these days as well, but in most any “Arizona charter educators vs. _________” I’m going to take our educators over the fill in the blank. It is your track record providing this confidence.
Data from Stanford University’s Opportunity Project show academic growth and proficiency by school for Arizona. The Stanford scholars linked state tests from across the country, giving us both proficiency and growth scores for most American public schools. You can look the numbers up by campus here.
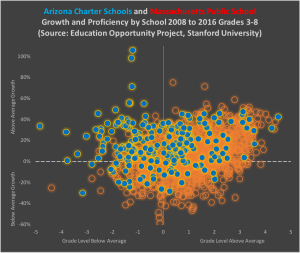
Some of you wondered, understandably, how Arizona’s charter schools look in the data, so let us address that now. The Stanford linking study allows us to compare schools across states. The figure above shows what the Arizona charter school performance compares to public schools in Massachusetts.
Massachusetts students displayed the highest NAEP scores on every exam during the period covered by the Stanford data (2008 to 2016). Massachusetts not only has a (deserved) reputation for high performing public schools, they also enjoy considerable demographic advantages-including one of the nation’s highest median incomes. Massachusetts schools also received north of $15,500 per pupil in 2016. In a linking study between NAEP and PISA math results Massachusetts ranked near the top, just behind Switzerland and just ahead of Japan. On paper matchup between Massachusetts and Arizona charters should not be close.
The chart above plots the growth and proficiency for all Massachusetts public schools and all Arizona charter schools included in the Stanford data. Approximately 58% of Massachusetts schools had academic growth above the national average during this period. 80% of Arizona charter schools included in the Stanford data had academic growth above the national average.
Approximately 49% of Massachusetts schools land in the above average proficiency/high growth quadrant (top right) in the chart above, and 40% of Arizona charter schools land in that quadrant. Massachusetts gets the better of proficiency, but Arizona charters take the prize on academic growth. Whether Arizona charters perform “better” than the nation’s highest performing public-school system depends basically upon how you rank academic proficiency and growth.
As we move into an uncertain future we should do so with a clear understanding of the record. The Stanford Opportunity project data (among others) shows that it really is quite extraordinary. Difficult months lie ahead, but remember that Japanese pilots dropped a total of six bombs on the Enterprise during the war, but nothing could stop her. I am betting that you cannot be stopped either.