Arizona’s Funding Gap: A Statewide Problem with a Local Origin
The Arizona legislature last revised K-12 public school funding in 1980, successfully equalizing it across the state. Over the past four decades, inequalities in funding have crept back into the system, and in 2023 the same Arizona student can generate wildly varying amounts of school funding by transferring between public schools including those within the same district, between schools in different districts, and transfers from a district to a public charter school. Arizona’s public charters receive substantially less per-pupil funding than their district counterparts.
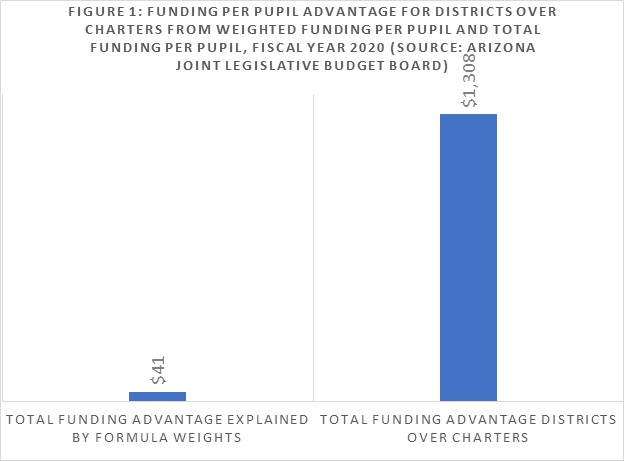
It is important to note that state formula funding weights do not account for the funding disparity between district and charter schools
Arizona funds schools through a complicated process involving local, state, and federal funding. The state’s funding formula provides additional funds per pupil for some students – for example students with disabilities, English Learners (ELs) among others. For purposes of clarity, Figure 2 presents a copy of the entire Joint Legislative Budget Committee (JLBC) document for Fiscal Year 2020 below.
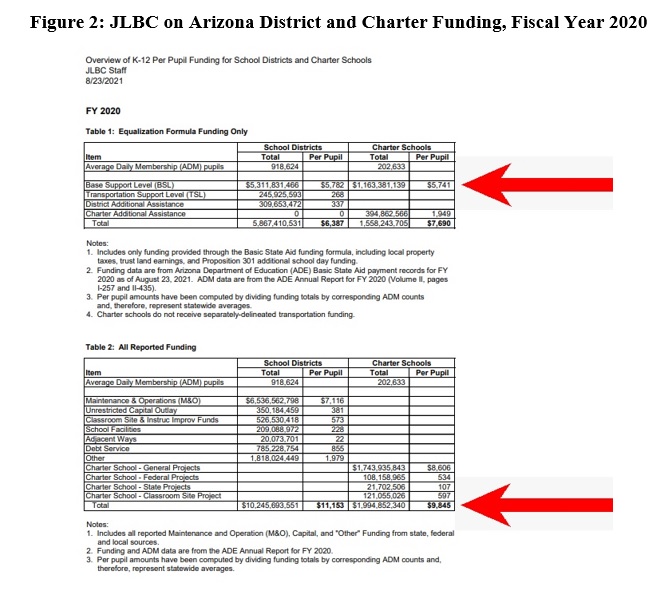
Figure 2: JLBC on Arizona District and Charter Funding, Fiscal Year 2020
The Arizona JLBC calculates the statewide total funding per pupil, a part of which includes a calculation of the “Base Support Level” (BSL) statewide on both districts and charters for Fiscal Year 2020 as indicated by the red arrow in Table 1. State officials confirmed that the BSL figure calculated by JLBC includes state student funding weights.
The average BSL for districts statewide was $5,782. BSL for Arizona charter schools stood at $5,741. The JLBC also calculated the total per pupil funding disparity at $1,308 in Fiscal Year 2020 as shown by the bottom red arrow in Table 2.[i] Figure 1 above displays both the formula weight driven difference, and the total funding difference per pupil.
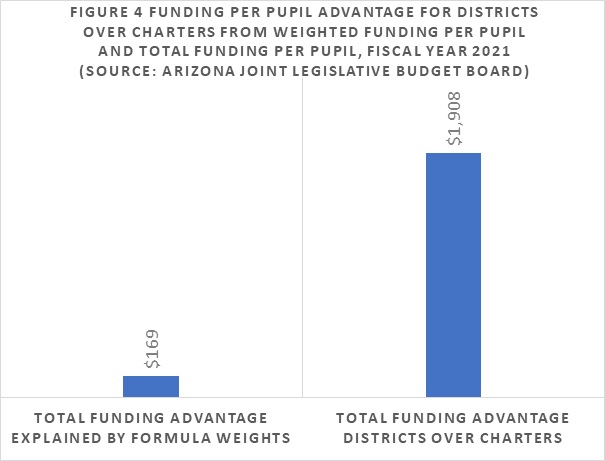
In Fiscal Year 2021 the weighted gap increased between district and charter schools, but not nearly as much as the overall gap between district and charter school funding. Figure 3 presents the entirety of the Fiscal Year 2021 JLBC document.
Figure 3: JLBC on Arizona District and Charter Funding, Fiscal Year 2021
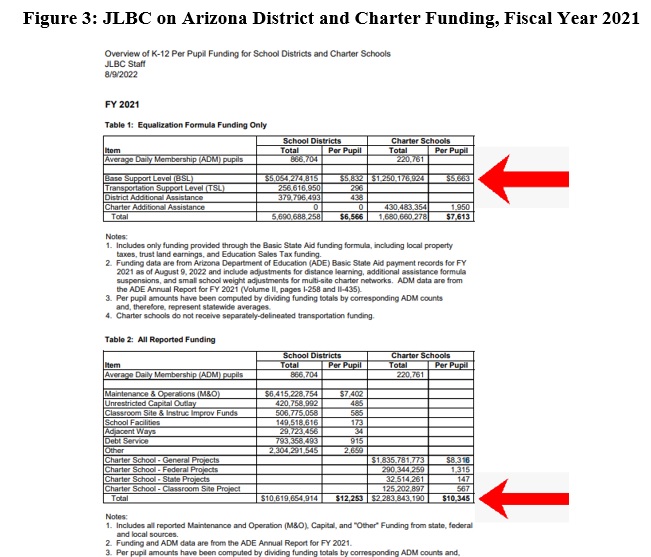
As the line for BSL in Table 1 shows, districts received an average of $5,832 in FY 2021, and charter schools $5,663 for a gap of $169 per pupil. Districts received $12,253 per pupil in Fiscal Year 2021, while charter schools received an average of $10,345. The total average per pupil funding gap increased from $1,308 in Fiscal Year 2020 to $1,908 in Fiscal Year 2021 in favor of districts.
While this may seem surprising, opponents of public charter schools have often claimed that Arizona charters engage in selective admissions to avoid students likely to generate funding weights. This is a politically motivated assertion that ignores the fact that public charter schools are legally required to use a random process in admissions. It also ignores the enrollment of tens of thousands of special needs students with funding weights in Arizona charter schools.
The following demonstrates that enrollment differences between districts and charters are not nearly as significant as often assumed. Moreover, some funding weights give districts an advantage over charters. To illustrate, in FY2020 the net of all the weights was approximately 3% of the funding disparity.
The remaining 97% of the per pupil funding disparity is the result of local funding. Ultimately, all taxpayer funds come from the same taxpayers, and all schools have a right to equal funding.
The Myth of Charter School “Creaming”
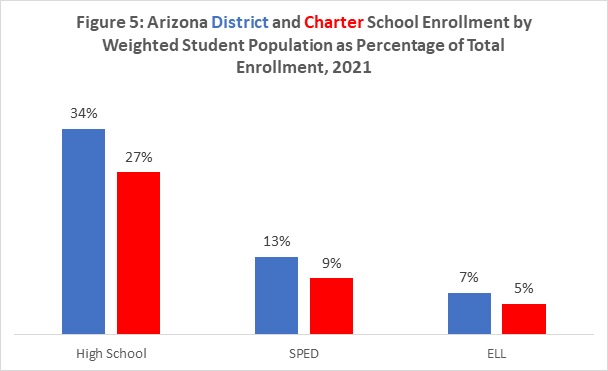
As is the case in most states, Arizona’s K-12 funding formula weights the enrollment counts of students in order to increase funding for particular student groups. Weights are differentiated for students with disabilities, English Learners (ELs), K-3 students, students attending small schools, high-school students, and after the 2022 legislative session, low-income students. Figure 5 below provides enrollment figures for student groups eligible for funding weights across Arizona public schools.
Furthermore, federal law requires and funds districts to conduct “Child Find” to identify and serve the needs of pre-school age children with disabilities.[ii] This process predates the advent of charter schools in America, and the federal government exclusively funds districts to engage in “Child Find” for students before they enroll in school. Families with children with disabilities thus are far more likely to come in contact with a school district, and will often have services provided to the child, when compared to charter schools.
Boston University Professor Marcus Winters conducted research demonstrating that differences between special education enrollment rates in districts and charters have multiple explanations. Examining New York City district and charter schools, he found that the families of special needs students were less likely to apply to charter schools and that charter schools identified a smaller percentage of students as qualifying as having a disability, especially in the category of “Specific Learning Disability” or SLD.[iii] Medical research has established that a high-percentage of students with a Specific Learning Disability (SLD) were mislabeled. For example, Dr. Reid Lyon of the National Institutes of Health established that the learning difficulties for a majority such students could be mediated through an intensive remedial reading course. Such students have been described as “teaching disabled” and 80% of students with an SLD label lack an actual neurological condition.[iv] A lower rate of SLD identification among charter schools could thus be a positive development.
Dr. Winters also found that the movement of students between the district and charter sectors does not contribute substantially to the special education enrollment gap.[v] Separately, an analysis of the test scores of students between Arizona’s district and charter sectors found that on average charters send higher than average scoring students to districts and receive lower than average performing students from districts.[vi] These findings, consistent with the Winters findings, weigh strongly against the notion that Arizona charters are systematically sending away students with disabilities.
Since their inception in 1994, Arizona charter schools have been required to hold a random admissions process. However, Arizona school districts still can and do exclude students with disabilities from open enrollment lotteries for students outside their zoned schools, given that the Individuals with Disabilities Education Act (IDEA) provides access for students only to their zoned district school. The applicability of federal anti-discrimination statutes remains as yet untested as it pertains to district open enrollment in Arizona.
Another myth about charter schools is that they educate fewer children with severe and/or multiple disabilities. Bearing in mind that these students receive the largest weights of any students in the system – in some cases almost up to eight times the per pupil funding.[vii] and given the small differences between districts and charters in BSL, these students are neither numerous enough to move the needle and/or have been largely counteracted by other weights.
Some funding weights clearly work to the advantage of districts over charters. For example, charter schools enroll a lower percentage of high-school students than districts. The weight for high school students thus works in favor of districts. Arizona provides a funding weight for small schools, but in 2015 lawmakers passed a bill, unfortunately rife with convoluted language, that resulted in denying the small school weight to most Arizona charter schools. Districts benefit from the small school weight more than charters. At the other end of the K-12 continuum, charter schools have a higher percentage of students in grades K-3, and thus derive more benefit from the weight for those students.
To reiterate, Arizona’s system of funding weights is complex, but fortunately the Joint Legislative Budget Board has calculated the net impact of weights on the per pupil funding imbalance. The various funding weights largely cancel each other out and resulted in districts receiving a statewide average of $41 additional dollars per student in Fiscal Year 2020.
Funding weights therefore do not account for the funding gap. Simply, local funding explains why Arizona districts receive more per-pupil funding on average than their public charter school counterparts.
Local Funding: the Driver of Funding Inequality
The JLBC document clearly presents the source of funding inequality between district and charter schools in Arizona. Figure 6 below presents the bottom of the Fiscal Year 2021 document with both the total and per pupil funding sources for districts. “Unrestricted Capital Outlay” and “Classroom Site & Instructional Improvement Funds” “School Facilities” “Adjacent Ways” “Debt Service” and “Other” (more on that in a bit) collectively generated over $4,204,426,162 Arizona school districts, or $4,851 per pupil. Arizona charter schools meanwhile received none of this funding.
Figure 6: All Reported Funding for Arizona Districts and Charter, Fiscal Year 2021 (Source: JLBC)
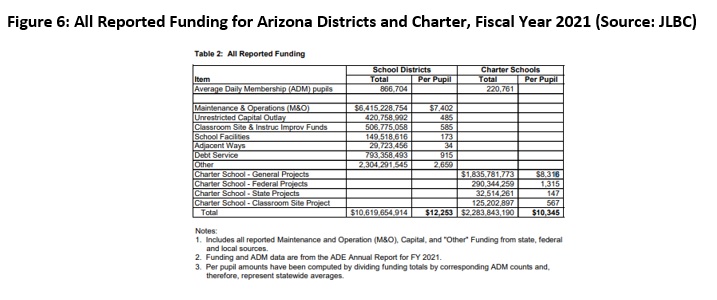
The state partially makes up for the lack of local funding by charter schools through “additional assistance” as shown in the JLBC document above on page 3. In Fiscal Year 2021, districts received $438 per pupil in additional assistance, while charters received $1,950 per pupil in additional assistance. Adding up all public funds from all sources in the “Total” row in the above chart reveals that Charter School Additional Assistance is inadequate to address the funding gap- with districts receiving an average of $1,908 per pupil less in Fiscal Year 2021.
The gap is not only large (18.4% less funding for charters in FY 2021) it has been growing.
When You Get Less but People Claim You Get More
The JLBC document deals in statewide averages, and that funding can vary greatly between individual school districts, and even between schools in the same district. Districts receive more funding per pupil on average than charters, but this does not mean that all districts receive more money per pupil than the charter average. Districts receiving bond, override, desegregation and small school funding – all local funding – tend to receive much higher amounts of per-pupil funding than those that do not.
Claims that Arizona charter schools get “more money” than districts consider only state funding. Each Arizona taxpayer however pays various local, state, and federal taxes. All local funding comes from the same source – the Arizona taxpayer.
Those closely involved in state policymaking can tend to focus almost exclusively on the state general fund. It is a mistake not to recognize that the same taxpayers who pay state taxes pay all other taxes as well. As shown below, the Superintendent of Public Instruction Annual Report presents the source of funding for Arizona district and charter schools between the 2010-11 and 2020-21 school years.[viii]
Figure 7: Percent of Revenue by Source for Districts and Charters (Source: Arizona Department of Education)
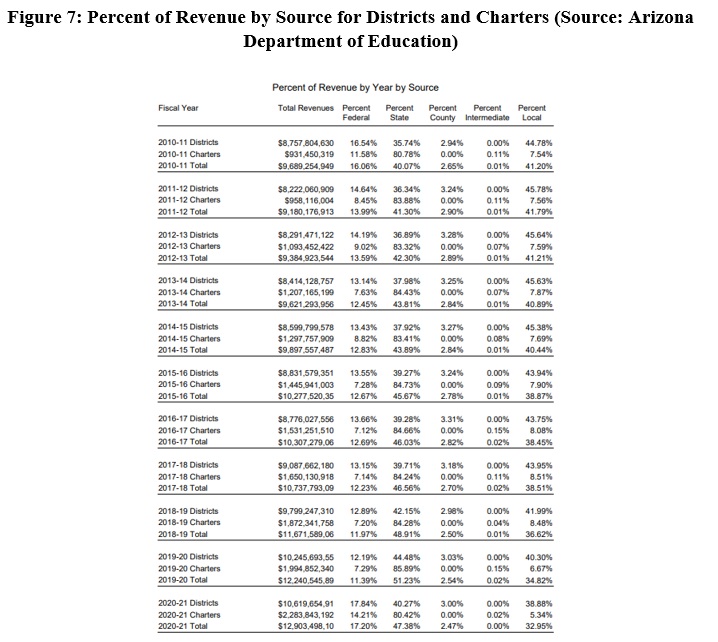
Districts received an average of 43.6% of their funding from local sources and another 3% of funds from counties. As shown in Figure 1, state charter school additional assistance only partially makes up for the funding disparity between districts and charters.
Funding Inequities Within and Between Arizona Districts
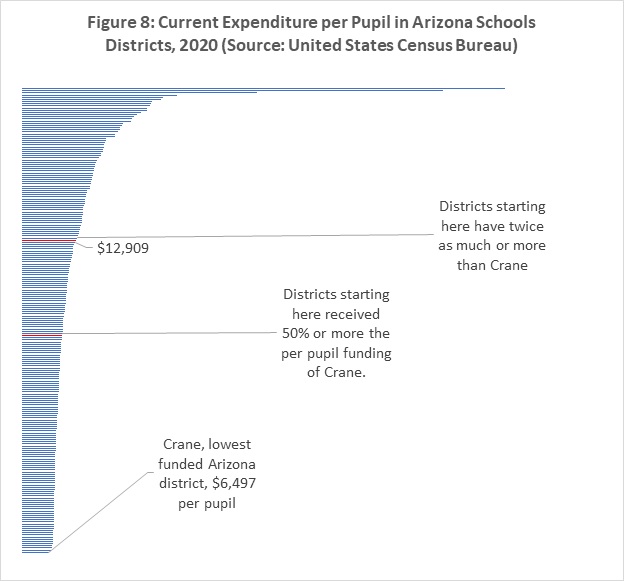
While the average funding inequity between Arizona’s district and charter school represents a large gap when calculated over many students , Arizona’s funding inequities do not end there. Data on total per-pupil spending in districts from the United States Census Bureau shows that in 2020, more than half of Arizona school districts spent 50% or more per pupil than the lowest funded district. Approximately a third of districts (71) spent double or more the amount per pupil as the lowest funded school district. A few of these districts at the top are unusually small – Crown King had only one student – and should not distract the reader from the overall trend of the data: district per pupil expenditure is highly inequitable.
An almost identical trend can be found within public schools within the same Arizona school district according to data the districts submitted to the Arizona department of education. For example, Figure 9 presents spending per pupil among in-person schools in Tucson Unified:
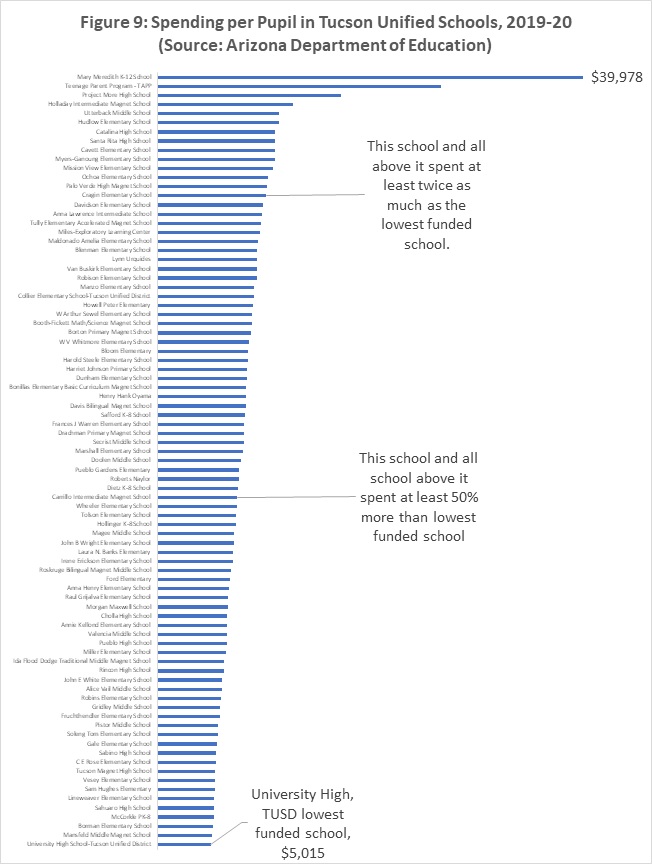
One public school spending eight times as much per pupil as another public school in the same school district is neither equitable or constitutional.
Conclusion: Arizona Local Funding Drives Funding Inequality
In the shadow of California’s Priest vs. Serrano decision, Arizona lawmakers succeeded in equalizing funding democratically in 1980. Ironically Arizona succeeded in funding equalization while the court efforts in California and other states failed to achieve their intended results. Many court-ordered finance reforms have not only failed; many have entirely backfired. Arizona’s inequalities have returned, driven primarily by local revenue. The efforts of the 1980 reforms have largely been undone: whether in the context of districts versus charters, district versus districts, or schools within districts, unequal funding appears repeatedly.
Arizonans have examples from the state’s history and from successful efforts in other states regarding funding equalization.[ix] The Arizona Constitution guarantees “Equal Privileges and Immunities” for all. That provision reads “No law shall be enacted granting to any citizen, class of citizens, or corporation other than municipal, privileges or immunities which, upon the same terms, shall not equally belong to all citizens or corporations.” In other words – special favors by government are unconstitutional; people must be treated equally and fairly.
Arizona’s system of funding schools does not live up to that guarantee. Today, students in the same Arizona family can generate remarkably different levels of funding simply by enrolling in different public schools – even within the same school district. Arizona’s school funding system has languished for decades. The time has come to remedy it.
___________________
[i] Arizona Joint Legislative Budget Committee. 2022. “Overview of K-12 Per Pupil Funding for School Districts and Charter Schools.” Publication of the Joint Legislative Budget Committee, available on the internet as https://www.azjlbc.gov/units/districtvscharterfunding.pdf.
[ii] Lee, Andrew M.I. 2022. “What Is Child Find?” Publication of Understood, available on the internet at https://www.understood.org/en/articles/child-find-what-it-is-and-how-it-works
[iii] Winters, Marcus. 2013. “Why the Gap? Special Education and New York City Charter Schools.” Publication of the Manhattan Institute, available on the internet at https://www.manhattan-institute.org/html/why-gap-special-education-and-new-york-city-charter-schools-5862.html
[iv] Lyon, G. R., Fletcher, J. M., Shaywitz, S. E., Shaywitz, B. A., Torgesen, J. K., Wood, F. B., Schulte, A., & Olson, R. (2001). Rethinking Learning-Disabilities. In C. E. Finn Jr., A. J. Rotherham, & C. R. Hokanson Jr. (Eds.), Rethinking Special Education for a New Century (pp. 259-287). Washington DC: Thomas B. Fordham Foundation.
[v] Ibid, Winters
[vi] Arizona Charter Schools Association. 2018. “Myth Busted: Public Charter Schools Do Not ‘Cream’ District Students.” Publication of the Arizona Charter Schools Association, available on the internet at https://azcharters.org/2018/08/15/myth-busted-public-charter-schools-do-not-cream-district-students/
[vii] Arizona School Business Officials Association. 2014. “Arizona School Finance Summary Manual.” Publication of the Arizona School Business Officials Association, available on the internet at https://www.sedona.k12.az.us/Downloads/aasbomanual.pdf.
[viii] Arizona Department of Education. “Annual Report of the Arizona Superintendent of Public Instruction Volume I
Fiscal Year 2020-2021.” Publication of the Arizona Department of Education, available on the internet at https://www.azed.gov/sites/default/files/2022/03/SAFR2021vol1.pdf. Page 5.
[ix] For details see Ladner, Matthew. 2022. “Back to the Future-the Case for Modernizing Arizona’s K-12 Funding Formula.” Publication of the Arizona Charter Schools Association, available on the internet at https://azcharters.org/2022/05/27/back-to-the-future-the-case-for-modernizing-arizonas-k-12-funding-formula/